Immigrants from Bahamas vs Barbadian Unemployment Among Women with Children Under 6 years
COMPARE
Immigrants from Bahamas
Barbadian
Unemployment Among Women with Children Under 6 years
Unemployment Among Women with Children Under 6 years Comparison
Immigrants from Bahamas
Barbadians
9.6%
UNEMPLOYMENT AMONG WOMEN WITH CHILDREN UNDER 6 YEARS
0.0/ 100
METRIC RATING
323rd/ 347
METRIC RANK
8.3%
UNEMPLOYMENT AMONG WOMEN WITH CHILDREN UNDER 6 YEARS
0.4/ 100
METRIC RATING
259th/ 347
METRIC RANK
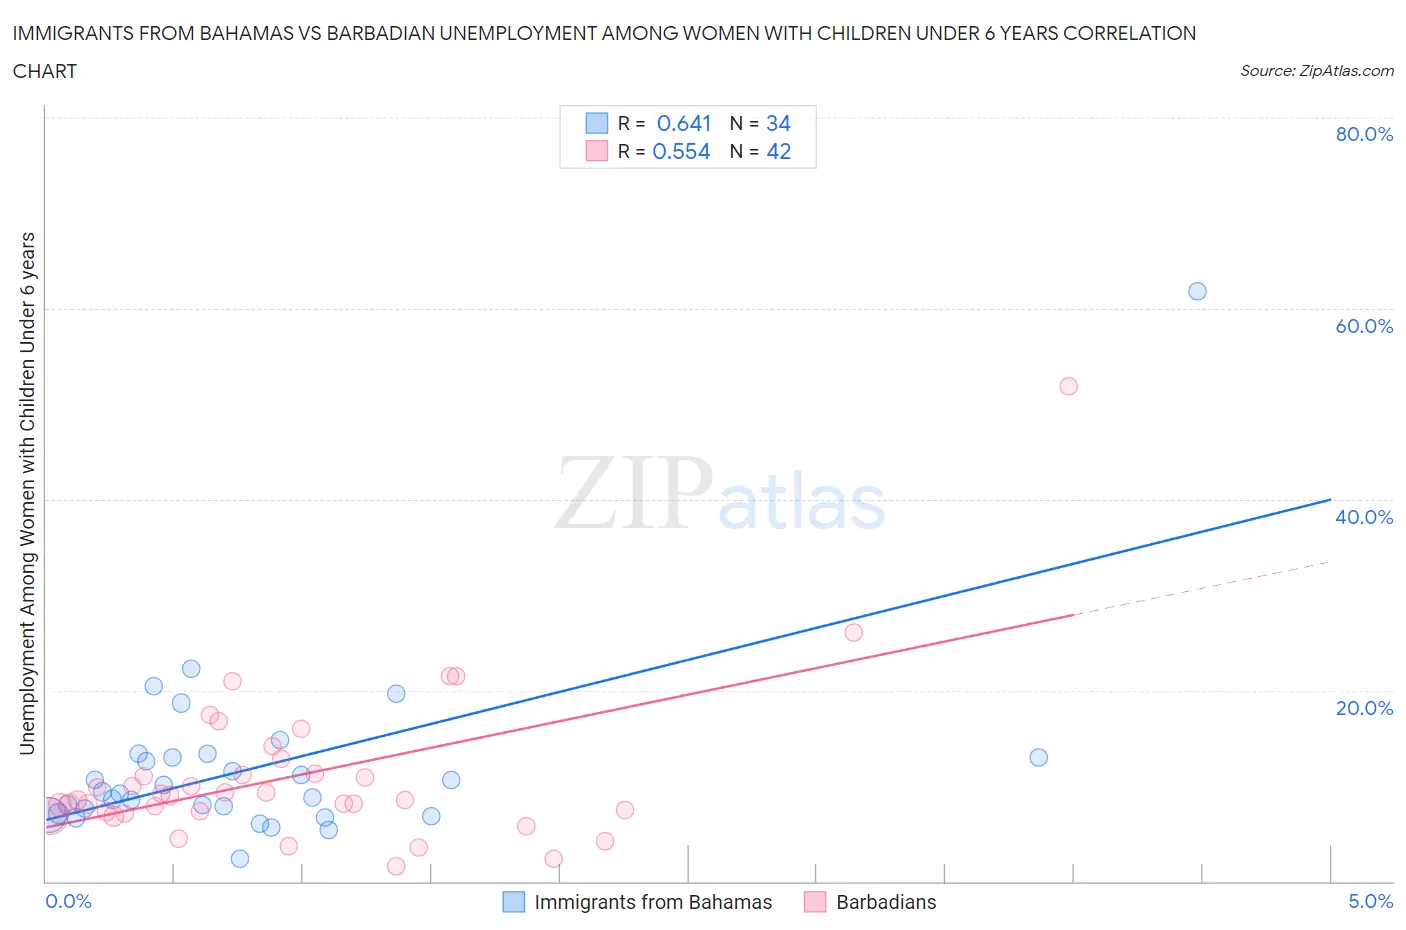
Immigrants from Bahamas vs Barbadian Unemployment Among Women with Children Under 6 years Correlation Chart
The statistical analysis conducted on geographies consisting of 94,063,271 people shows a significant positive correlation between the proportion of Immigrants from Bahamas and unemployment rate among women with children under the age of 6 in the United States with a correlation coefficient (R) of 0.641 and weighted average of 9.6%. Similarly, the statistical analysis conducted on geographies consisting of 125,746,302 people shows a substantial positive correlation between the proportion of Barbadians and unemployment rate among women with children under the age of 6 in the United States with a correlation coefficient (R) of 0.554 and weighted average of 8.3%, a difference of 15.4%.
Unemployment Among Women with Children Under 6 years Correlation Summary
| Measurement | Immigrants from Bahamas | Barbadian |
| Minimum | 2.3% | 1.6% |
| Maximum | 61.8% | 51.9% |
| Range | 59.5% | 50.3% |
| Mean | 11.9% | 11.0% |
| Median | 9.3% | 8.8% |
| Interquartile 25% (IQ1) | 7.1% | 7.3% |
| Interquartile 75% (IQ3) | 12.9% | 11.3% |
| Interquartile Range (IQR) | 5.8% | 4.0% |
| Standard Deviation (Sample) | 9.9% | 8.4% |
| Standard Deviation (Population) | 9.8% | 8.3% |
Similar Demographics by Unemployment Among Women with Children Under 6 years
Demographics Similar to Immigrants from Bahamas by Unemployment Among Women with Children Under 6 years
In terms of unemployment among women with children under 6 years, the demographic groups most similar to Immigrants from Bahamas are Alaska Native (9.6%, a difference of 0.19%), Central American Indian (9.6%, a difference of 0.44%), Potawatomi (9.6%, a difference of 0.50%), Marshallese (9.6%, a difference of 0.55%), and Paiute (9.7%, a difference of 0.70%).
| Demographics | Rating | Rank | Unemployment Among Women with Children Under 6 years |
| Houma | 0.0 /100 | #316 | Tragic 9.4% |
| Dutch West Indians | 0.0 /100 | #317 | Tragic 9.5% |
| Osage | 0.0 /100 | #318 | Tragic 9.5% |
| Marshallese | 0.0 /100 | #319 | Tragic 9.6% |
| Potawatomi | 0.0 /100 | #320 | Tragic 9.6% |
| Central American Indians | 0.0 /100 | #321 | Tragic 9.6% |
| Alaska Natives | 0.0 /100 | #322 | Tragic 9.6% |
| Immigrants | Bahamas | 0.0 /100 | #323 | Tragic 9.6% |
| Paiute | 0.0 /100 | #324 | Tragic 9.7% |
| Choctaw | 0.0 /100 | #325 | Tragic 9.8% |
| Delaware | 0.0 /100 | #326 | Tragic 9.8% |
| Ottawa | 0.0 /100 | #327 | Tragic 9.9% |
| Tohono O'odham | 0.0 /100 | #328 | Tragic 10.2% |
| Blacks/African Americans | 0.0 /100 | #329 | Tragic 10.3% |
| Pennsylvania Germans | 0.0 /100 | #330 | Tragic 10.8% |
Demographics Similar to Barbadians by Unemployment Among Women with Children Under 6 years
In terms of unemployment among women with children under 6 years, the demographic groups most similar to Barbadians are White/Caucasian (8.4%, a difference of 0.26%), Immigrants from Ghana (8.3%, a difference of 0.29%), British West Indian (8.3%, a difference of 0.31%), Immigrants from Liberia (8.4%, a difference of 0.54%), and West Indian (8.4%, a difference of 0.55%).
| Demographics | Rating | Rank | Unemployment Among Women with Children Under 6 years |
| Ghanaians | 1.0 /100 | #252 | Tragic 8.2% |
| Immigrants | Guyana | 0.8 /100 | #253 | Tragic 8.2% |
| Immigrants | Caribbean | 0.7 /100 | #254 | Tragic 8.3% |
| Immigrants | Portugal | 0.6 /100 | #255 | Tragic 8.3% |
| Celtics | 0.6 /100 | #256 | Tragic 8.3% |
| British West Indians | 0.5 /100 | #257 | Tragic 8.3% |
| Immigrants | Ghana | 0.5 /100 | #258 | Tragic 8.3% |
| Barbadians | 0.4 /100 | #259 | Tragic 8.3% |
| Whites/Caucasians | 0.3 /100 | #260 | Tragic 8.4% |
| Immigrants | Liberia | 0.3 /100 | #261 | Tragic 8.4% |
| West Indians | 0.3 /100 | #262 | Tragic 8.4% |
| Scotch-Irish | 0.3 /100 | #263 | Tragic 8.4% |
| Hondurans | 0.3 /100 | #264 | Tragic 8.4% |
| French Canadians | 0.3 /100 | #265 | Tragic 8.4% |
| Immigrants | Honduras | 0.3 /100 | #266 | Tragic 8.4% |