Immigrants from Panama vs Scandinavian Unemployment Among Women with Children Ages 6 to 17 years
COMPARE
Immigrants from Panama
Scandinavian
Unemployment Among Women with Children Ages 6 to 17 years
Unemployment Among Women with Children Ages 6 to 17 years Comparison
Immigrants from Panama
Scandinavians
9.1%
UNEMPLOYMENT AMONG WOMEN WITH CHILDREN AGES 6 TO 17 YEARS
24.3/ 100
METRIC RATING
197th/ 347
METRIC RANK
8.6%
UNEMPLOYMENT AMONG WOMEN WITH CHILDREN AGES 6 TO 17 YEARS
98.3/ 100
METRIC RATING
103rd/ 347
METRIC RANK
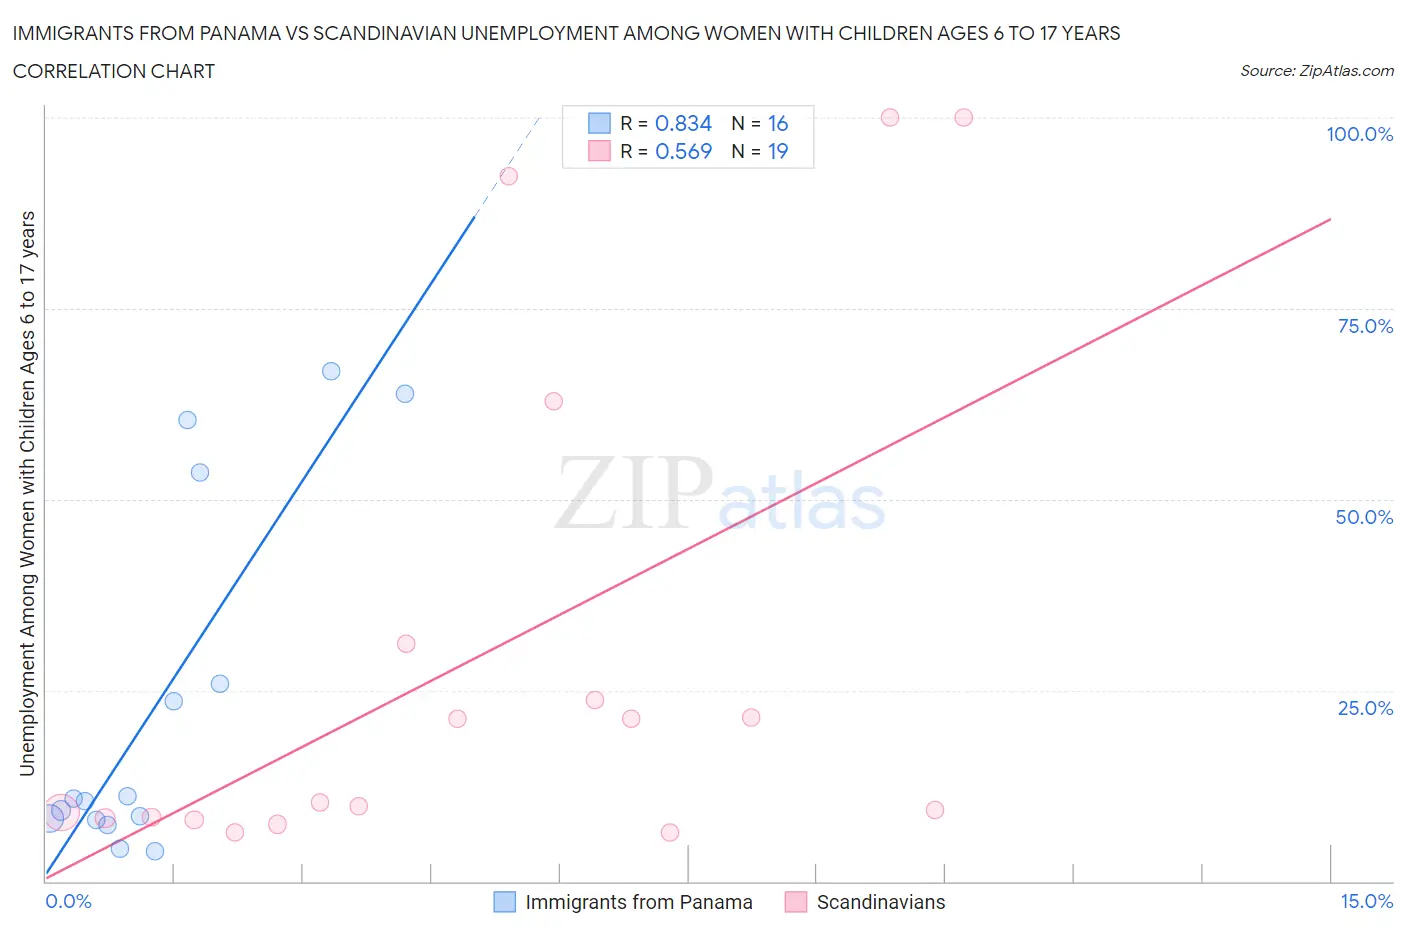
Immigrants from Panama vs Scandinavian Unemployment Among Women with Children Ages 6 to 17 years Correlation Chart
The statistical analysis conducted on geographies consisting of 179,700,690 people shows a very strong positive correlation between the proportion of Immigrants from Panama and unemployment rate among women with children between the ages 6 and 17 in the United States with a correlation coefficient (R) of 0.834 and weighted average of 9.1%. Similarly, the statistical analysis conducted on geographies consisting of 313,345,365 people shows a substantial positive correlation between the proportion of Scandinavians and unemployment rate among women with children between the ages 6 and 17 in the United States with a correlation coefficient (R) of 0.569 and weighted average of 8.6%, a difference of 6.0%.
Unemployment Among Women with Children Ages 6 to 17 years Correlation Summary
| Measurement | Immigrants from Panama | Scandinavian |
| Minimum | 3.9% | 6.3% |
| Maximum | 66.7% | 100.0% |
| Range | 62.8% | 93.7% |
| Mean | 23.5% | 29.3% |
| Median | 10.6% | 10.3% |
| Interquartile 25% (IQ1) | 8.1% | 8.3% |
| Interquartile 75% (IQ3) | 39.7% | 31.1% |
| Interquartile Range (IQR) | 31.6% | 22.8% |
| Standard Deviation (Sample) | 23.3% | 33.1% |
| Standard Deviation (Population) | 22.6% | 32.2% |
Similar Demographics by Unemployment Among Women with Children Ages 6 to 17 years
Demographics Similar to Immigrants from Panama by Unemployment Among Women with Children Ages 6 to 17 years
In terms of unemployment among women with children ages 6 to 17 years, the demographic groups most similar to Immigrants from Panama are Brazilian (9.1%, a difference of 0.010%), Austrian (9.1%, a difference of 0.040%), Immigrants from Kazakhstan (9.1%, a difference of 0.060%), Immigrants from Turkey (9.1%, a difference of 0.090%), and Guyanese (9.1%, a difference of 0.15%).
| Demographics | Rating | Rank | Unemployment Among Women with Children Ages 6 to 17 years |
| Slovenes | 28.5 /100 | #190 | Fair 9.1% |
| Belizeans | 28.4 /100 | #191 | Fair 9.1% |
| Guamanians/Chamorros | 27.2 /100 | #192 | Fair 9.1% |
| Immigrants | Turkey | 25.8 /100 | #193 | Fair 9.1% |
| Immigrants | Kazakhstan | 25.3 /100 | #194 | Fair 9.1% |
| Austrians | 25.0 /100 | #195 | Fair 9.1% |
| Brazilians | 24.4 /100 | #196 | Fair 9.1% |
| Immigrants | Panama | 24.3 /100 | #197 | Fair 9.1% |
| Guyanese | 21.8 /100 | #198 | Fair 9.1% |
| Czechoslovakians | 20.8 /100 | #199 | Fair 9.1% |
| Trinidadians and Tobagonians | 18.2 /100 | #200 | Poor 9.1% |
| Immigrants | Trinidad and Tobago | 16.7 /100 | #201 | Poor 9.1% |
| Immigrants | Middle Africa | 15.6 /100 | #202 | Poor 9.1% |
| Maltese | 15.3 /100 | #203 | Poor 9.1% |
| Immigrants | Canada | 15.3 /100 | #204 | Poor 9.1% |
Demographics Similar to Scandinavians by Unemployment Among Women with Children Ages 6 to 17 years
In terms of unemployment among women with children ages 6 to 17 years, the demographic groups most similar to Scandinavians are Immigrants from South Africa (8.6%, a difference of 0.010%), Immigrants from Pakistan (8.6%, a difference of 0.030%), Immigrants from Lithuania (8.6%, a difference of 0.040%), New Zealander (8.6%, a difference of 0.040%), and Malaysian (8.6%, a difference of 0.11%).
| Demographics | Rating | Rank | Unemployment Among Women with Children Ages 6 to 17 years |
| German Russians | 98.6 /100 | #96 | Exceptional 8.5% |
| Bolivians | 98.5 /100 | #97 | Exceptional 8.5% |
| Malaysians | 98.5 /100 | #98 | Exceptional 8.6% |
| Immigrants | Lithuania | 98.4 /100 | #99 | Exceptional 8.6% |
| New Zealanders | 98.4 /100 | #100 | Exceptional 8.6% |
| Immigrants | Pakistan | 98.4 /100 | #101 | Exceptional 8.6% |
| Immigrants | South Africa | 98.3 /100 | #102 | Exceptional 8.6% |
| Scandinavians | 98.3 /100 | #103 | Exceptional 8.6% |
| Immigrants | France | 98.0 /100 | #104 | Exceptional 8.6% |
| Immigrants | Norway | 97.8 /100 | #105 | Exceptional 8.6% |
| Immigrants | Serbia | 97.7 /100 | #106 | Exceptional 8.6% |
| Chickasaw | 97.6 /100 | #107 | Exceptional 8.6% |
| Swedes | 97.6 /100 | #108 | Exceptional 8.6% |
| Immigrants | Romania | 97.5 /100 | #109 | Exceptional 8.6% |
| Latvians | 97.4 /100 | #110 | Exceptional 8.6% |