Immigrants from Asia vs Native Hawaiian Female Unemployment
COMPARE
Immigrants from Asia
Native Hawaiian
Female Unemployment
Female Unemployment Comparison
Immigrants from Asia
Native Hawaiians
5.2%
FEMALE UNEMPLOYMENT
64.3/ 100
METRIC RATING
163rd/ 347
METRIC RANK
5.2%
FEMALE UNEMPLOYMENT
62.7/ 100
METRIC RATING
166th/ 347
METRIC RANK
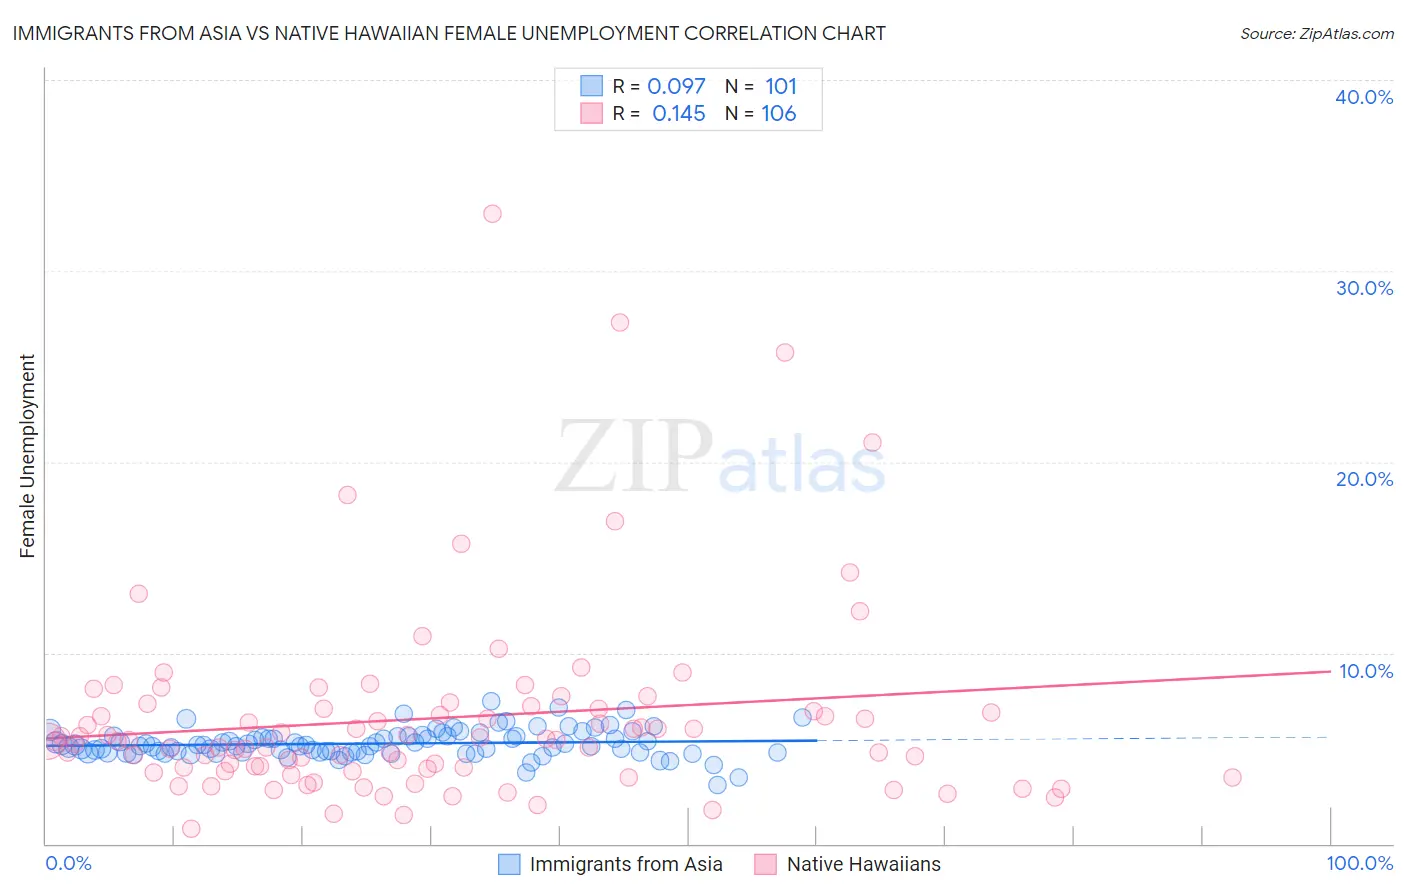
Immigrants from Asia vs Native Hawaiian Female Unemployment Correlation Chart
The statistical analysis conducted on geographies consisting of 540,737,875 people shows a slight positive correlation between the proportion of Immigrants from Asia and unemploymnet rate among females in the United States with a correlation coefficient (R) of 0.097 and weighted average of 5.2%. Similarly, the statistical analysis conducted on geographies consisting of 330,662,641 people shows a poor positive correlation between the proportion of Native Hawaiians and unemploymnet rate among females in the United States with a correlation coefficient (R) of 0.145 and weighted average of 5.2%, a difference of 0.10%.
Female Unemployment Correlation Summary
| Measurement | Immigrants from Asia | Native Hawaiian |
| Minimum | 3.1% | 0.80% |
| Maximum | 7.5% | 33.0% |
| Range | 4.4% | 32.2% |
| Mean | 5.2% | 6.6% |
| Median | 5.2% | 5.4% |
| Interquartile 25% (IQ1) | 4.8% | 4.0% |
| Interquartile 75% (IQ3) | 5.6% | 7.1% |
| Interquartile Range (IQR) | 0.82% | 3.1% |
| Standard Deviation (Sample) | 0.72% | 5.1% |
| Standard Deviation (Population) | 0.72% | 5.1% |
Demographics Similar to Immigrants from Asia and Native Hawaiians by Female Unemployment
In terms of female unemployment, the demographic groups most similar to Immigrants from Asia are Bangladeshi (5.2%, a difference of 0.0%), Syrian (5.2%, a difference of 0.10%), Potawatomi (5.2%, a difference of 0.11%), Immigrants from Thailand (5.2%, a difference of 0.14%), and Immigrants from Pakistan (5.2%, a difference of 0.16%). Similarly, the demographic groups most similar to Native Hawaiians are Syrian (5.2%, a difference of 0.0%), Immigrants from Thailand (5.2%, a difference of 0.040%), Bangladeshi (5.2%, a difference of 0.10%), Potawatomi (5.2%, a difference of 0.21%), and Sri Lankan (5.2%, a difference of 0.21%).
| Demographics | Rating | Rank | Female Unemployment |
| South Africans | 70.8 /100 | #154 | Good 5.2% |
| Immigrants | Egypt | 70.0 /100 | #155 | Good 5.2% |
| Immigrants | Northern Africa | 69.6 /100 | #156 | Good 5.2% |
| Immigrants | Russia | 69.3 /100 | #157 | Good 5.2% |
| Albanians | 68.3 /100 | #158 | Good 5.2% |
| Immigrants | Micronesia | 66.9 /100 | #159 | Good 5.2% |
| Immigrants | Spain | 66.8 /100 | #160 | Good 5.2% |
| Immigrants | Pakistan | 66.7 /100 | #161 | Good 5.2% |
| Potawatomi | 65.9 /100 | #162 | Good 5.2% |
| Immigrants | Asia | 64.3 /100 | #163 | Good 5.2% |
| Bangladeshis | 64.3 /100 | #164 | Good 5.2% |
| Syrians | 62.8 /100 | #165 | Good 5.2% |
| Native Hawaiians | 62.7 /100 | #166 | Good 5.2% |
| Immigrants | Thailand | 62.1 /100 | #167 | Good 5.2% |
| Sri Lankans | 59.4 /100 | #168 | Average 5.2% |
| Immigrants | Chile | 59.0 /100 | #169 | Average 5.2% |
| Spanish | 55.9 /100 | #170 | Average 5.2% |
| Immigrants | Denmark | 55.0 /100 | #171 | Average 5.2% |
| Immigrants | Uganda | 50.7 /100 | #172 | Average 5.3% |
| Iranians | 50.4 /100 | #173 | Average 5.3% |
| Immigrants | Poland | 50.0 /100 | #174 | Average 5.3% |