Immigrants from Albania vs Jordanian Unemployment
COMPARE
Immigrants from Albania
Jordanian
Unemployment
Unemployment Comparison
Immigrants from Albania
Jordanians
5.4%
UNEMPLOYMENT
13.5/ 100
METRIC RATING
217th/ 347
METRIC RANK
5.0%
UNEMPLOYMENT
96.4/ 100
METRIC RATING
89th/ 347
METRIC RANK
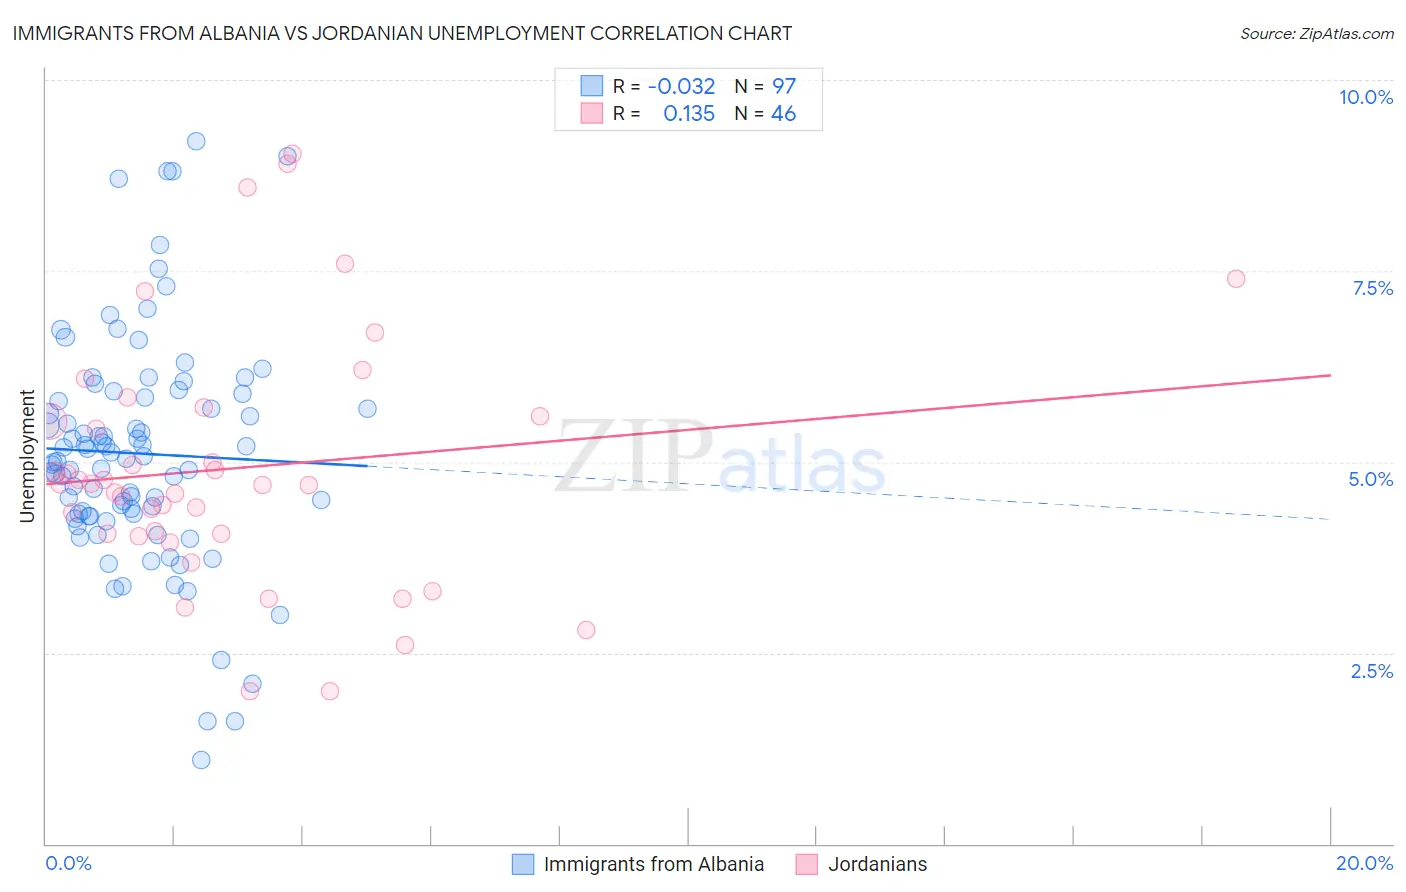
Immigrants from Albania vs Jordanian Unemployment Correlation Chart
The statistical analysis conducted on geographies consisting of 119,392,247 people shows no correlation between the proportion of Immigrants from Albania and unemployment in the United States with a correlation coefficient (R) of -0.032 and weighted average of 5.4%. Similarly, the statistical analysis conducted on geographies consisting of 166,387,098 people shows a poor positive correlation between the proportion of Jordanians and unemployment in the United States with a correlation coefficient (R) of 0.135 and weighted average of 5.0%, a difference of 8.3%.
Unemployment Correlation Summary
| Measurement | Immigrants from Albania | Jordanian |
| Minimum | 1.1% | 2.0% |
| Maximum | 9.2% | 9.0% |
| Range | 8.1% | 7.0% |
| Mean | 5.1% | 4.9% |
| Median | 5.0% | 4.7% |
| Interquartile 25% (IQ1) | 4.3% | 4.1% |
| Interquartile 75% (IQ3) | 5.9% | 5.6% |
| Interquartile Range (IQR) | 1.6% | 1.5% |
| Standard Deviation (Sample) | 1.5% | 1.6% |
| Standard Deviation (Population) | 1.5% | 1.6% |
Similar Demographics by Unemployment
Demographics Similar to Immigrants from Albania by Unemployment
In terms of unemployment, the demographic groups most similar to Immigrants from Albania are Immigrants from South America (5.4%, a difference of 0.0%), Choctaw (5.4%, a difference of 0.10%), Delaware (5.4%, a difference of 0.16%), Immigrants from Middle Africa (5.4%, a difference of 0.22%), and Immigrants from Costa Rica (5.4%, a difference of 0.22%).
| Demographics | Rating | Rank | Unemployment |
| Immigrants | Iraq | 18.6 /100 | #210 | Poor 5.4% |
| Iraqis | 18.1 /100 | #211 | Poor 5.4% |
| Ugandans | 18.0 /100 | #212 | Poor 5.4% |
| Immigrants | Middle Africa | 15.3 /100 | #213 | Poor 5.4% |
| Immigrants | Costa Rica | 15.2 /100 | #214 | Poor 5.4% |
| Delaware | 14.7 /100 | #215 | Poor 5.4% |
| Immigrants | South America | 13.5 /100 | #216 | Poor 5.4% |
| Immigrants | Albania | 13.5 /100 | #217 | Poor 5.4% |
| Choctaw | 12.7 /100 | #218 | Poor 5.4% |
| Bangladeshis | 11.2 /100 | #219 | Poor 5.4% |
| Soviet Union | 10.6 /100 | #220 | Poor 5.4% |
| Immigrants | Philippines | 10.4 /100 | #221 | Poor 5.4% |
| Iroquois | 10.3 /100 | #222 | Poor 5.4% |
| Seminole | 9.2 /100 | #223 | Tragic 5.4% |
| Israelis | 8.8 /100 | #224 | Tragic 5.4% |
Demographics Similar to Jordanians by Unemployment
In terms of unemployment, the demographic groups most similar to Jordanians are Immigrants from North Macedonia (5.0%, a difference of 0.040%), Immigrants from Sudan (5.0%, a difference of 0.050%), Immigrants from South Africa (5.0%, a difference of 0.070%), Immigrants from Korea (5.0%, a difference of 0.090%), and Immigrants from Moldova (5.0%, a difference of 0.12%).
| Demographics | Rating | Rank | Unemployment |
| Fijians | 97.6 /100 | #82 | Exceptional 5.0% |
| Hmong | 97.6 /100 | #83 | Exceptional 5.0% |
| Russians | 97.4 /100 | #84 | Exceptional 5.0% |
| Immigrants | Australia | 97.0 /100 | #85 | Exceptional 5.0% |
| Hungarians | 96.9 /100 | #86 | Exceptional 5.0% |
| Immigrants | Moldova | 96.6 /100 | #87 | Exceptional 5.0% |
| Immigrants | Korea | 96.6 /100 | #88 | Exceptional 5.0% |
| Jordanians | 96.4 /100 | #89 | Exceptional 5.0% |
| Immigrants | North Macedonia | 96.3 /100 | #90 | Exceptional 5.0% |
| Immigrants | Sudan | 96.3 /100 | #91 | Exceptional 5.0% |
| Immigrants | South Africa | 96.2 /100 | #92 | Exceptional 5.0% |
| Ukrainians | 96.0 /100 | #93 | Exceptional 5.0% |
| Immigrants | Austria | 95.9 /100 | #94 | Exceptional 5.0% |
| Immigrants | Serbia | 95.6 /100 | #95 | Exceptional 5.0% |
| Immigrants | England | 95.2 /100 | #96 | Exceptional 5.0% |