Immigrants from Albania vs Moroccan Unemployment
COMPARE
Immigrants from Albania
Moroccan
Unemployment
Unemployment Comparison
Immigrants from Albania
Moroccans
5.4%
UNEMPLOYMENT
13.5/ 100
METRIC RATING
217th/ 347
METRIC RANK
5.5%
UNEMPLOYMENT
3.2/ 100
METRIC RATING
237th/ 347
METRIC RANK
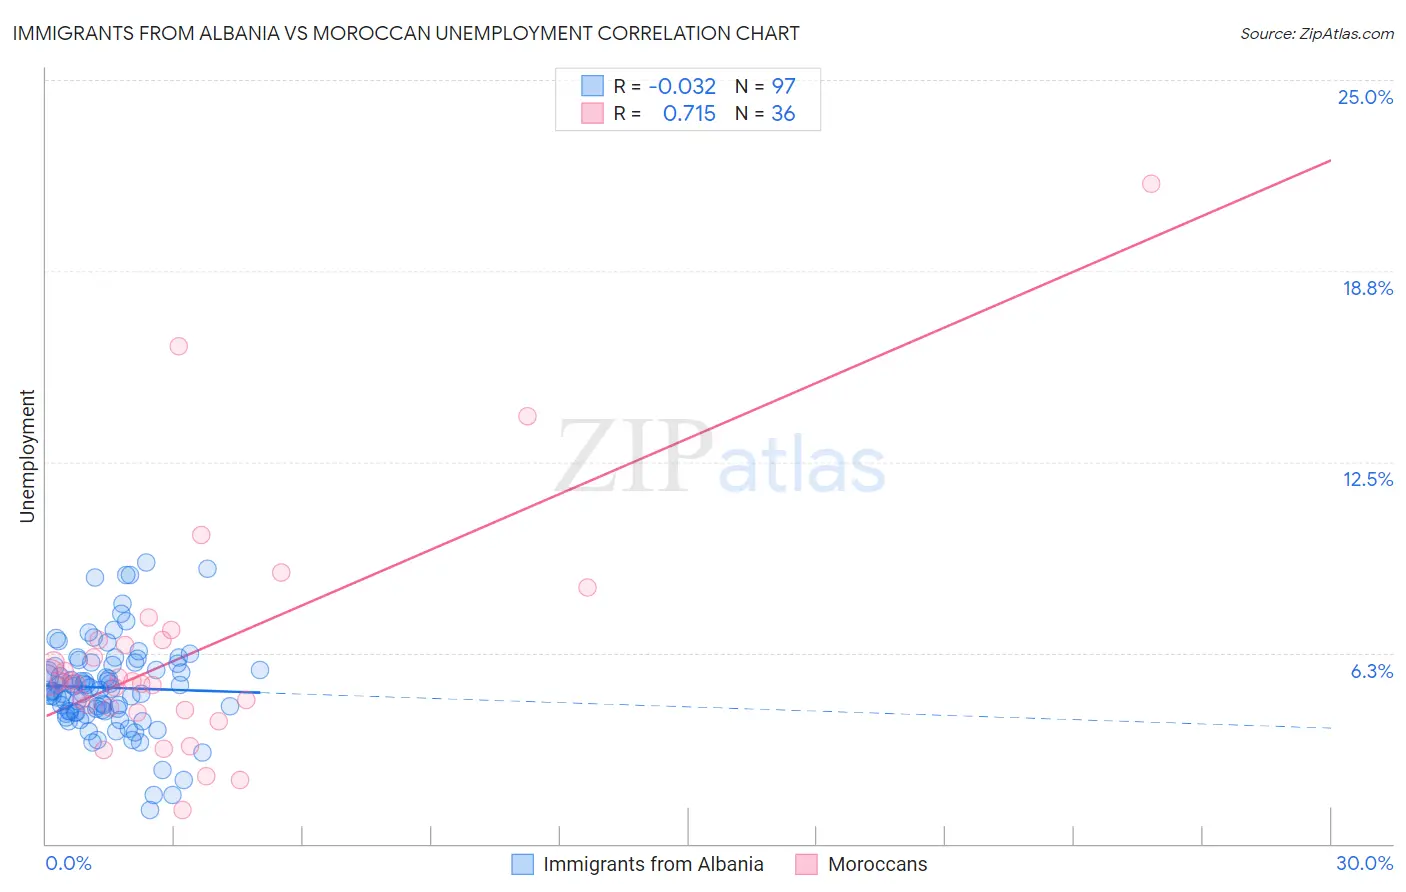
Immigrants from Albania vs Moroccan Unemployment Correlation Chart
The statistical analysis conducted on geographies consisting of 119,392,247 people shows no correlation between the proportion of Immigrants from Albania and unemployment in the United States with a correlation coefficient (R) of -0.032 and weighted average of 5.4%. Similarly, the statistical analysis conducted on geographies consisting of 201,766,508 people shows a strong positive correlation between the proportion of Moroccans and unemployment in the United States with a correlation coefficient (R) of 0.715 and weighted average of 5.5%, a difference of 2.3%.
Unemployment Correlation Summary
| Measurement | Immigrants from Albania | Moroccan |
| Minimum | 1.1% | 1.1% |
| Maximum | 9.2% | 21.6% |
| Range | 8.1% | 20.5% |
| Mean | 5.1% | 6.2% |
| Median | 5.0% | 5.3% |
| Interquartile 25% (IQ1) | 4.3% | 4.4% |
| Interquartile 75% (IQ3) | 5.9% | 6.7% |
| Interquartile Range (IQR) | 1.6% | 2.3% |
| Standard Deviation (Sample) | 1.5% | 4.0% |
| Standard Deviation (Population) | 1.5% | 3.9% |
Demographics Similar to Immigrants from Albania and Moroccans by Unemployment
In terms of unemployment, the demographic groups most similar to Immigrants from Albania are Choctaw (5.4%, a difference of 0.10%), Bangladeshi (5.4%, a difference of 0.32%), Soviet Union (5.4%, a difference of 0.40%), Immigrants from Philippines (5.4%, a difference of 0.43%), and Iroquois (5.4%, a difference of 0.46%). Similarly, the demographic groups most similar to Moroccans are Immigrants from Cambodia (5.5%, a difference of 0.060%), Immigrants from Panama (5.5%, a difference of 0.090%), Panamanian (5.5%, a difference of 0.60%), Immigrants from Syria (5.5%, a difference of 0.63%), and Immigrants from Africa (5.5%, a difference of 0.68%).
| Demographics | Rating | Rank | Unemployment |
| Immigrants | Albania | 13.5 /100 | #217 | Poor 5.4% |
| Choctaw | 12.7 /100 | #218 | Poor 5.4% |
| Bangladeshis | 11.2 /100 | #219 | Poor 5.4% |
| Soviet Union | 10.6 /100 | #220 | Poor 5.4% |
| Immigrants | Philippines | 10.4 /100 | #221 | Poor 5.4% |
| Iroquois | 10.3 /100 | #222 | Poor 5.4% |
| Seminole | 9.2 /100 | #223 | Tragic 5.4% |
| Israelis | 8.8 /100 | #224 | Tragic 5.4% |
| South American Indians | 7.8 /100 | #225 | Tragic 5.5% |
| Samoans | 7.1 /100 | #226 | Tragic 5.5% |
| Immigrants | Lebanon | 7.0 /100 | #227 | Tragic 5.5% |
| Guamanians/Chamorros | 6.3 /100 | #228 | Tragic 5.5% |
| Hawaiians | 5.4 /100 | #229 | Tragic 5.5% |
| Ottawa | 5.4 /100 | #230 | Tragic 5.5% |
| Immigrants | Africa | 4.9 /100 | #231 | Tragic 5.5% |
| Comanche | 4.9 /100 | #232 | Tragic 5.5% |
| Immigrants | Syria | 4.8 /100 | #233 | Tragic 5.5% |
| Panamanians | 4.7 /100 | #234 | Tragic 5.5% |
| Immigrants | Panama | 3.4 /100 | #235 | Tragic 5.5% |
| Immigrants | Cambodia | 3.3 /100 | #236 | Tragic 5.5% |
| Moroccans | 3.2 /100 | #237 | Tragic 5.5% |