Immigrants from Albania vs Jamaican Unemployment
COMPARE
Immigrants from Albania
Jamaican
Unemployment
Unemployment Comparison
Immigrants from Albania
Jamaicans
5.4%
UNEMPLOYMENT
13.5/ 100
METRIC RATING
217th/ 347
METRIC RANK
6.3%
UNEMPLOYMENT
0.0/ 100
METRIC RATING
297th/ 347
METRIC RANK
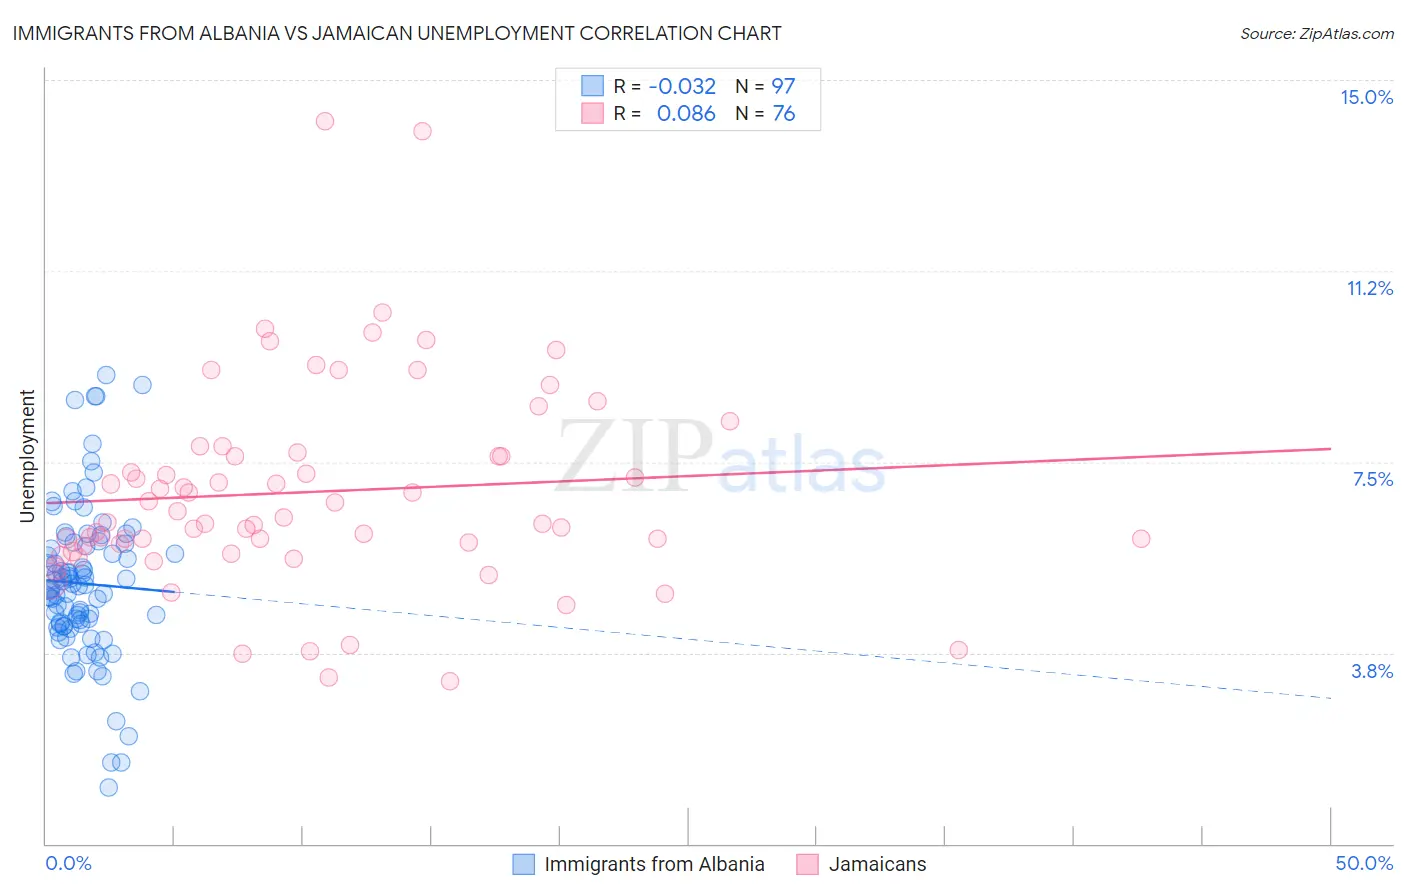
Immigrants from Albania vs Jamaican Unemployment Correlation Chart
The statistical analysis conducted on geographies consisting of 119,392,247 people shows no correlation between the proportion of Immigrants from Albania and unemployment in the United States with a correlation coefficient (R) of -0.032 and weighted average of 5.4%. Similarly, the statistical analysis conducted on geographies consisting of 367,761,379 people shows a slight positive correlation between the proportion of Jamaicans and unemployment in the United States with a correlation coefficient (R) of 0.086 and weighted average of 6.3%, a difference of 16.5%.
Unemployment Correlation Summary
| Measurement | Immigrants from Albania | Jamaican |
| Minimum | 1.1% | 3.2% |
| Maximum | 9.2% | 14.2% |
| Range | 8.1% | 11.0% |
| Mean | 5.1% | 6.9% |
| Median | 5.0% | 6.4% |
| Interquartile 25% (IQ1) | 4.3% | 5.9% |
| Interquartile 75% (IQ3) | 5.9% | 7.7% |
| Interquartile Range (IQR) | 1.6% | 1.8% |
| Standard Deviation (Sample) | 1.5% | 2.0% |
| Standard Deviation (Population) | 1.5% | 2.0% |
Similar Demographics by Unemployment
Demographics Similar to Immigrants from Albania by Unemployment
In terms of unemployment, the demographic groups most similar to Immigrants from Albania are Immigrants from South America (5.4%, a difference of 0.0%), Choctaw (5.4%, a difference of 0.10%), Delaware (5.4%, a difference of 0.16%), Immigrants from Middle Africa (5.4%, a difference of 0.22%), and Immigrants from Costa Rica (5.4%, a difference of 0.22%).
| Demographics | Rating | Rank | Unemployment |
| Immigrants | Iraq | 18.6 /100 | #210 | Poor 5.4% |
| Iraqis | 18.1 /100 | #211 | Poor 5.4% |
| Ugandans | 18.0 /100 | #212 | Poor 5.4% |
| Immigrants | Middle Africa | 15.3 /100 | #213 | Poor 5.4% |
| Immigrants | Costa Rica | 15.2 /100 | #214 | Poor 5.4% |
| Delaware | 14.7 /100 | #215 | Poor 5.4% |
| Immigrants | South America | 13.5 /100 | #216 | Poor 5.4% |
| Immigrants | Albania | 13.5 /100 | #217 | Poor 5.4% |
| Choctaw | 12.7 /100 | #218 | Poor 5.4% |
| Bangladeshis | 11.2 /100 | #219 | Poor 5.4% |
| Soviet Union | 10.6 /100 | #220 | Poor 5.4% |
| Immigrants | Philippines | 10.4 /100 | #221 | Poor 5.4% |
| Iroquois | 10.3 /100 | #222 | Poor 5.4% |
| Seminole | 9.2 /100 | #223 | Tragic 5.4% |
| Israelis | 8.8 /100 | #224 | Tragic 5.4% |
Demographics Similar to Jamaicans by Unemployment
In terms of unemployment, the demographic groups most similar to Jamaicans are Immigrants from Haiti (6.3%, a difference of 0.090%), Immigrants from West Indies (6.3%, a difference of 0.14%), Immigrants from Trinidad and Tobago (6.3%, a difference of 0.26%), Ute (6.3%, a difference of 0.34%), and Trinidadian and Tobagonian (6.3%, a difference of 0.74%).
| Demographics | Rating | Rank | Unemployment |
| Senegalese | 0.0 /100 | #290 | Tragic 6.2% |
| Haitians | 0.0 /100 | #291 | Tragic 6.2% |
| Central American Indians | 0.0 /100 | #292 | Tragic 6.2% |
| Immigrants | Ecuador | 0.0 /100 | #293 | Tragic 6.2% |
| Spanish American Indians | 0.0 /100 | #294 | Tragic 6.2% |
| U.S. Virgin Islanders | 0.0 /100 | #295 | Tragic 6.3% |
| Ute | 0.0 /100 | #296 | Tragic 6.3% |
| Jamaicans | 0.0 /100 | #297 | Tragic 6.3% |
| Immigrants | Haiti | 0.0 /100 | #298 | Tragic 6.3% |
| Immigrants | West Indies | 0.0 /100 | #299 | Tragic 6.3% |
| Immigrants | Trinidad and Tobago | 0.0 /100 | #300 | Tragic 6.3% |
| Trinidadians and Tobagonians | 0.0 /100 | #301 | Tragic 6.3% |
| West Indians | 0.0 /100 | #302 | Tragic 6.4% |
| Belizeans | 0.0 /100 | #303 | Tragic 6.4% |
| Immigrants | Jamaica | 0.0 /100 | #304 | Tragic 6.4% |