Houma vs White/Caucasian 7th Grade
COMPARE
Houma
White/Caucasian
7th Grade
7th Grade Comparison
Houma
Whites/Caucasians
95.1%
7TH GRADE
0.2/ 100
METRIC RATING
270th/ 347
METRIC RANK
97.0%
7TH GRADE
99.8/ 100
METRIC RATING
58th/ 347
METRIC RANK
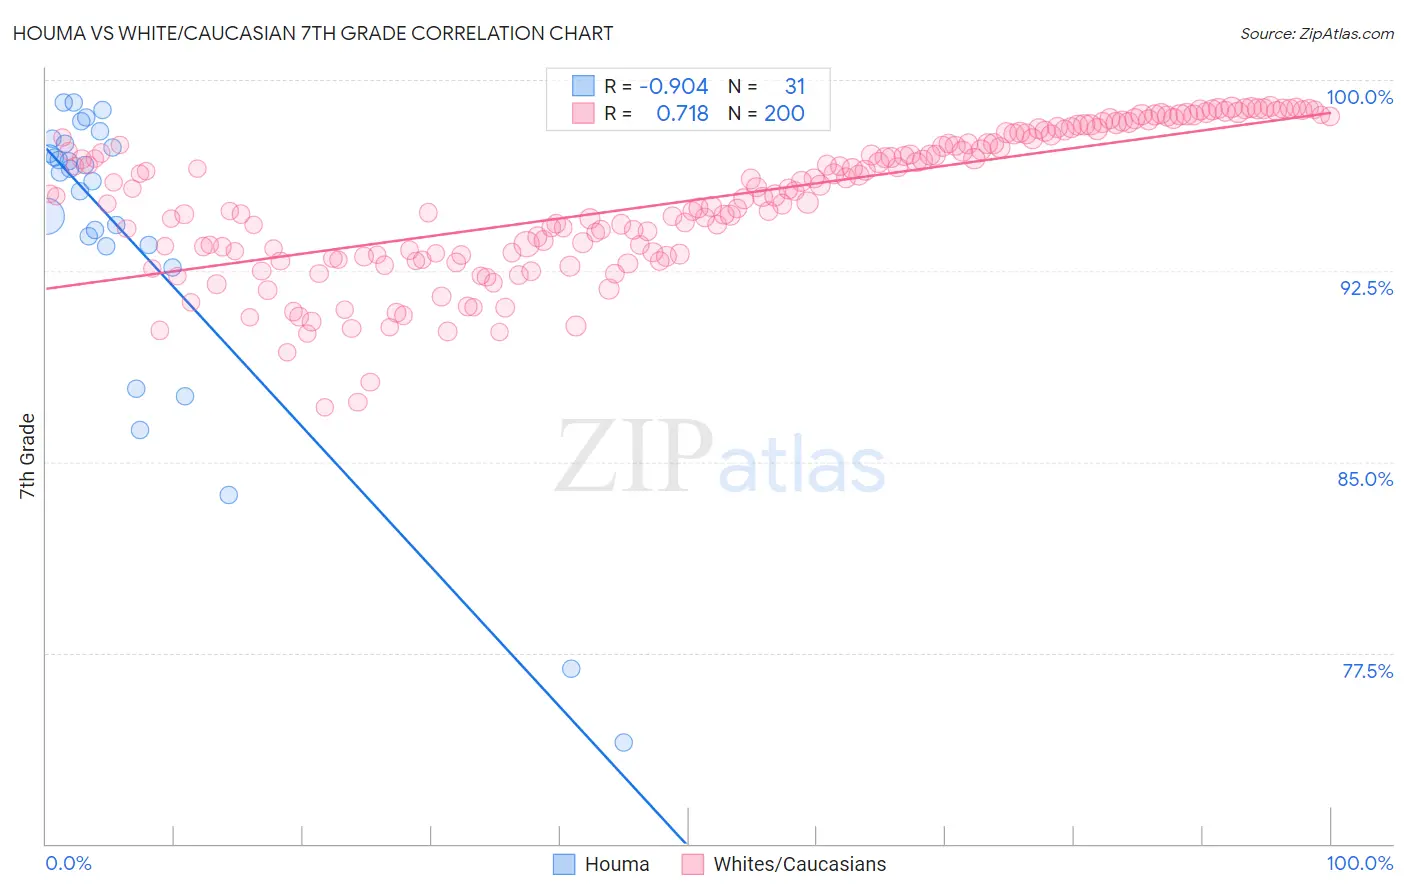
Houma vs White/Caucasian 7th Grade Correlation Chart
The statistical analysis conducted on geographies consisting of 36,795,916 people shows a near-perfect negative correlation between the proportion of Houma and percentage of population with at least 7th grade education in the United States with a correlation coefficient (R) of -0.904 and weighted average of 95.1%. Similarly, the statistical analysis conducted on geographies consisting of 585,247,077 people shows a strong positive correlation between the proportion of Whites/Caucasians and percentage of population with at least 7th grade education in the United States with a correlation coefficient (R) of 0.718 and weighted average of 97.0%, a difference of 1.9%.
7th Grade Correlation Summary
| Measurement | Houma | White/Caucasian |
| Minimum | 74.0% | 87.2% |
| Maximum | 99.1% | 99.0% |
| Range | 25.2% | 11.8% |
| Mean | 93.8% | 95.3% |
| Median | 96.4% | 95.5% |
| Interquartile 25% (IQ1) | 93.5% | 93.2% |
| Interquartile 75% (IQ3) | 97.5% | 97.8% |
| Interquartile Range (IQR) | 4.0% | 4.6% |
| Standard Deviation (Sample) | 6.2% | 2.8% |
| Standard Deviation (Population) | 6.1% | 2.8% |
Similar Demographics by 7th Grade
Demographics Similar to Houma by 7th Grade
In terms of 7th grade, the demographic groups most similar to Houma are Immigrants from South America (95.1%, a difference of 0.0%), Peruvian (95.1%, a difference of 0.0%), Immigrants from Uzbekistan (95.1%, a difference of 0.010%), Immigrants from Western Africa (95.1%, a difference of 0.010%), and Trinidadian and Tobagonian (95.2%, a difference of 0.020%).
| Demographics | Rating | Rank | 7th Grade |
| West Indians | 0.5 /100 | #263 | Tragic 95.2% |
| Immigrants | Nigeria | 0.4 /100 | #264 | Tragic 95.2% |
| Immigrants | Uruguay | 0.3 /100 | #265 | Tragic 95.2% |
| Immigrants | Ghana | 0.3 /100 | #266 | Tragic 95.2% |
| Yuman | 0.3 /100 | #267 | Tragic 95.2% |
| Immigrants | Hong Kong | 0.3 /100 | #268 | Tragic 95.2% |
| Trinidadians and Tobagonians | 0.3 /100 | #269 | Tragic 95.2% |
| Houma | 0.2 /100 | #270 | Tragic 95.1% |
| Immigrants | South America | 0.2 /100 | #271 | Tragic 95.1% |
| Peruvians | 0.2 /100 | #272 | Tragic 95.1% |
| Immigrants | Uzbekistan | 0.2 /100 | #273 | Tragic 95.1% |
| Immigrants | Western Africa | 0.2 /100 | #274 | Tragic 95.1% |
| Immigrants | Colombia | 0.2 /100 | #275 | Tragic 95.1% |
| Immigrants | Thailand | 0.2 /100 | #276 | Tragic 95.1% |
| Immigrants | Afghanistan | 0.2 /100 | #277 | Tragic 95.1% |
Demographics Similar to Whites/Caucasians by 7th Grade
In terms of 7th grade, the demographic groups most similar to Whites/Caucasians are Macedonian (97.0%, a difference of 0.0%), American (97.0%, a difference of 0.010%), Immigrants from Canada (96.9%, a difference of 0.010%), Creek (96.9%, a difference of 0.010%), and Russian (97.0%, a difference of 0.020%).
| Demographics | Rating | Rank | 7th Grade |
| Estonians | 99.9 /100 | #51 | Exceptional 97.0% |
| Greeks | 99.9 /100 | #52 | Exceptional 97.0% |
| Austrians | 99.8 /100 | #53 | Exceptional 97.0% |
| Australians | 99.8 /100 | #54 | Exceptional 97.0% |
| Russians | 99.8 /100 | #55 | Exceptional 97.0% |
| Serbians | 99.8 /100 | #56 | Exceptional 97.0% |
| Americans | 99.8 /100 | #57 | Exceptional 97.0% |
| Whites/Caucasians | 99.8 /100 | #58 | Exceptional 97.0% |
| Macedonians | 99.8 /100 | #59 | Exceptional 97.0% |
| Immigrants | Canada | 99.8 /100 | #60 | Exceptional 96.9% |
| Creek | 99.8 /100 | #61 | Exceptional 96.9% |
| Immigrants | North America | 99.8 /100 | #62 | Exceptional 96.9% |
| Immigrants | Northern Europe | 99.7 /100 | #63 | Exceptional 96.9% |
| Immigrants | Austria | 99.7 /100 | #64 | Exceptional 96.9% |
| Canadians | 99.7 /100 | #65 | Exceptional 96.9% |