Afghan vs Immigrants from Guatemala Female Unemployment
COMPARE
Afghan
Immigrants from Guatemala
Female Unemployment
Female Unemployment Comparison
Afghans
Immigrants from Guatemala
5.3%
FEMALE UNEMPLOYMENT
33.9/ 100
METRIC RATING
188th/ 347
METRIC RANK
6.1%
FEMALE UNEMPLOYMENT
0.0/ 100
METRIC RATING
287th/ 347
METRIC RANK
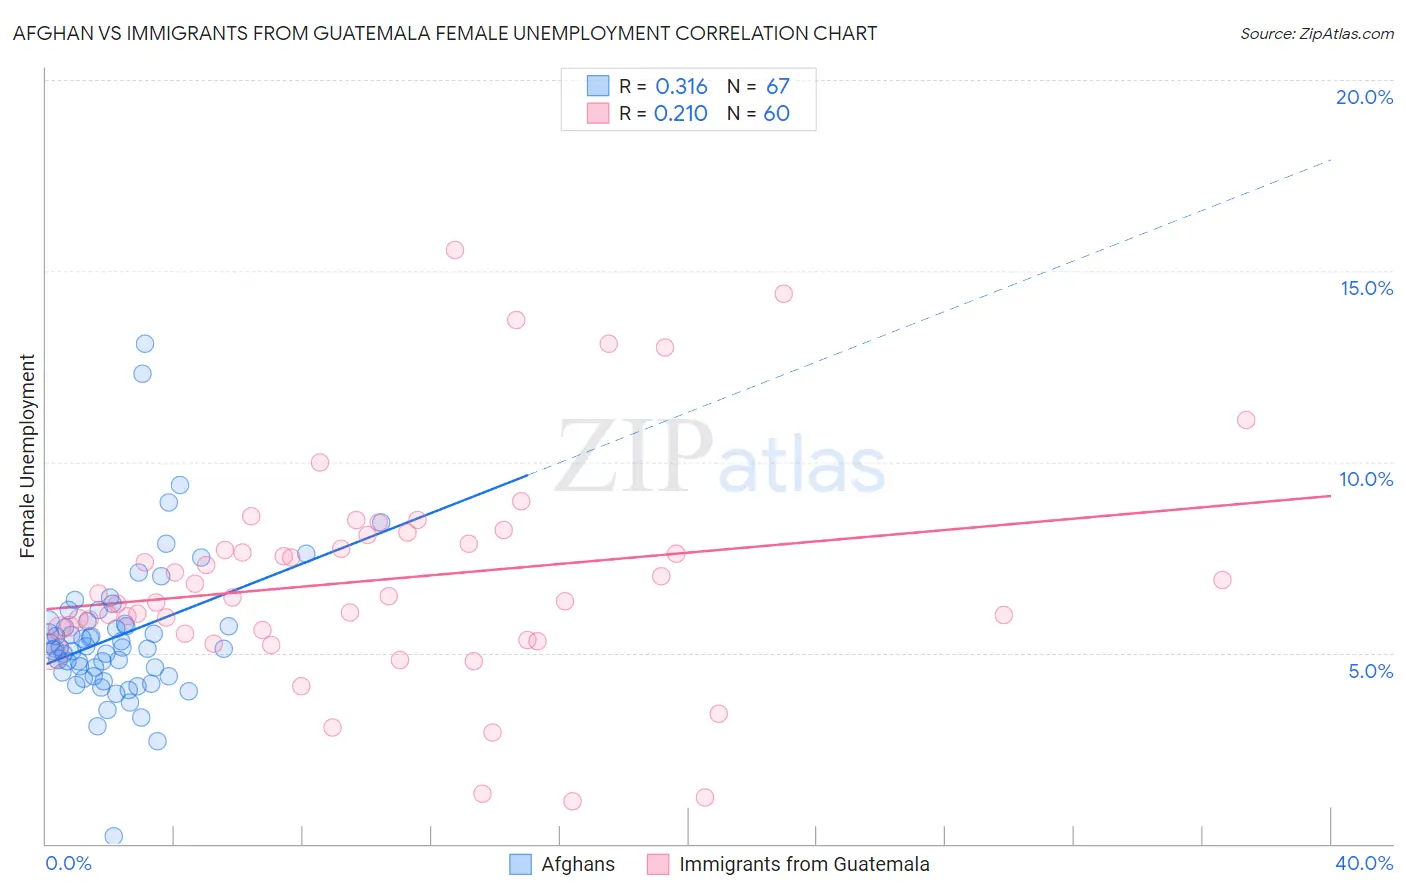
Afghan vs Immigrants from Guatemala Female Unemployment Correlation Chart
The statistical analysis conducted on geographies consisting of 148,787,124 people shows a mild positive correlation between the proportion of Afghans and unemploymnet rate among females in the United States with a correlation coefficient (R) of 0.316 and weighted average of 5.3%. Similarly, the statistical analysis conducted on geographies consisting of 375,756,424 people shows a weak positive correlation between the proportion of Immigrants from Guatemala and unemploymnet rate among females in the United States with a correlation coefficient (R) of 0.210 and weighted average of 6.1%, a difference of 14.6%.
Female Unemployment Correlation Summary
| Measurement | Afghan | Immigrants from Guatemala |
| Minimum | 0.20% | 1.1% |
| Maximum | 13.1% | 15.6% |
| Range | 12.9% | 14.5% |
| Mean | 5.4% | 6.9% |
| Median | 5.1% | 6.5% |
| Interquartile 25% (IQ1) | 4.4% | 5.5% |
| Interquartile 75% (IQ3) | 5.8% | 8.0% |
| Interquartile Range (IQR) | 1.4% | 2.4% |
| Standard Deviation (Sample) | 1.9% | 2.9% |
| Standard Deviation (Population) | 1.9% | 2.9% |
Similar Demographics by Female Unemployment
Demographics Similar to Afghans by Female Unemployment
In terms of female unemployment, the demographic groups most similar to Afghans are Costa Rican (5.3%, a difference of 0.0%), Immigrants from Albania (5.3%, a difference of 0.10%), Ugandan (5.3%, a difference of 0.18%), Cherokee (5.3%, a difference of 0.21%), and Immigrants from Belarus (5.3%, a difference of 0.35%).
| Demographics | Rating | Rank | Female Unemployment |
| Taiwanese | 42.7 /100 | #181 | Average 5.3% |
| Immigrants | Nonimmigrants | 42.6 /100 | #182 | Average 5.3% |
| Immigrants | Indonesia | 40.7 /100 | #183 | Average 5.3% |
| Immigrants | Ukraine | 40.1 /100 | #184 | Average 5.3% |
| Malaysians | 40.1 /100 | #185 | Average 5.3% |
| Immigrants | Belarus | 39.4 /100 | #186 | Fair 5.3% |
| Immigrants | Albania | 35.4 /100 | #187 | Fair 5.3% |
| Afghans | 33.9 /100 | #188 | Fair 5.3% |
| Costa Ricans | 33.8 /100 | #189 | Fair 5.3% |
| Ugandans | 31.2 /100 | #190 | Fair 5.3% |
| Cherokee | 30.8 /100 | #191 | Fair 5.3% |
| Portuguese | 28.6 /100 | #192 | Fair 5.3% |
| Arabs | 27.7 /100 | #193 | Fair 5.3% |
| Colombians | 27.0 /100 | #194 | Fair 5.3% |
| Immigrants | Colombia | 26.2 /100 | #195 | Fair 5.3% |
Demographics Similar to Immigrants from Guatemala by Female Unemployment
In terms of female unemployment, the demographic groups most similar to Immigrants from Guatemala are Chippewa (6.1%, a difference of 0.030%), Haitian (6.1%, a difference of 0.040%), Immigrants from Cabo Verde (6.1%, a difference of 0.050%), Trinidadian and Tobagonian (6.1%, a difference of 0.050%), and Immigrants from Caribbean (6.1%, a difference of 0.11%).
| Demographics | Rating | Rank | Female Unemployment |
| Mexican American Indians | 0.0 /100 | #280 | Tragic 6.0% |
| Guatemalans | 0.0 /100 | #281 | Tragic 6.0% |
| Colville | 0.0 /100 | #282 | Tragic 6.0% |
| Salvadorans | 0.0 /100 | #283 | Tragic 6.0% |
| Immigrants | Senegal | 0.0 /100 | #284 | Tragic 6.1% |
| Immigrants | Cabo Verde | 0.0 /100 | #285 | Tragic 6.1% |
| Chippewa | 0.0 /100 | #286 | Tragic 6.1% |
| Immigrants | Guatemala | 0.0 /100 | #287 | Tragic 6.1% |
| Haitians | 0.0 /100 | #288 | Tragic 6.1% |
| Trinidadians and Tobagonians | 0.0 /100 | #289 | Tragic 6.1% |
| Immigrants | Caribbean | 0.0 /100 | #290 | Tragic 6.1% |
| Immigrants | West Indies | 0.0 /100 | #291 | Tragic 6.1% |
| Immigrants | Trinidad and Tobago | 0.0 /100 | #292 | Tragic 6.1% |
| Mexicans | 0.0 /100 | #293 | Tragic 6.1% |
| Immigrants | El Salvador | 0.0 /100 | #294 | Tragic 6.1% |