Belgian vs Immigrants from Guatemala Female Unemployment
COMPARE
Belgian
Immigrants from Guatemala
Female Unemployment
Female Unemployment Comparison
Belgians
Immigrants from Guatemala
4.6%
FEMALE UNEMPLOYMENT
100.0/ 100
METRIC RATING
13th/ 347
METRIC RANK
6.1%
FEMALE UNEMPLOYMENT
0.0/ 100
METRIC RATING
287th/ 347
METRIC RANK
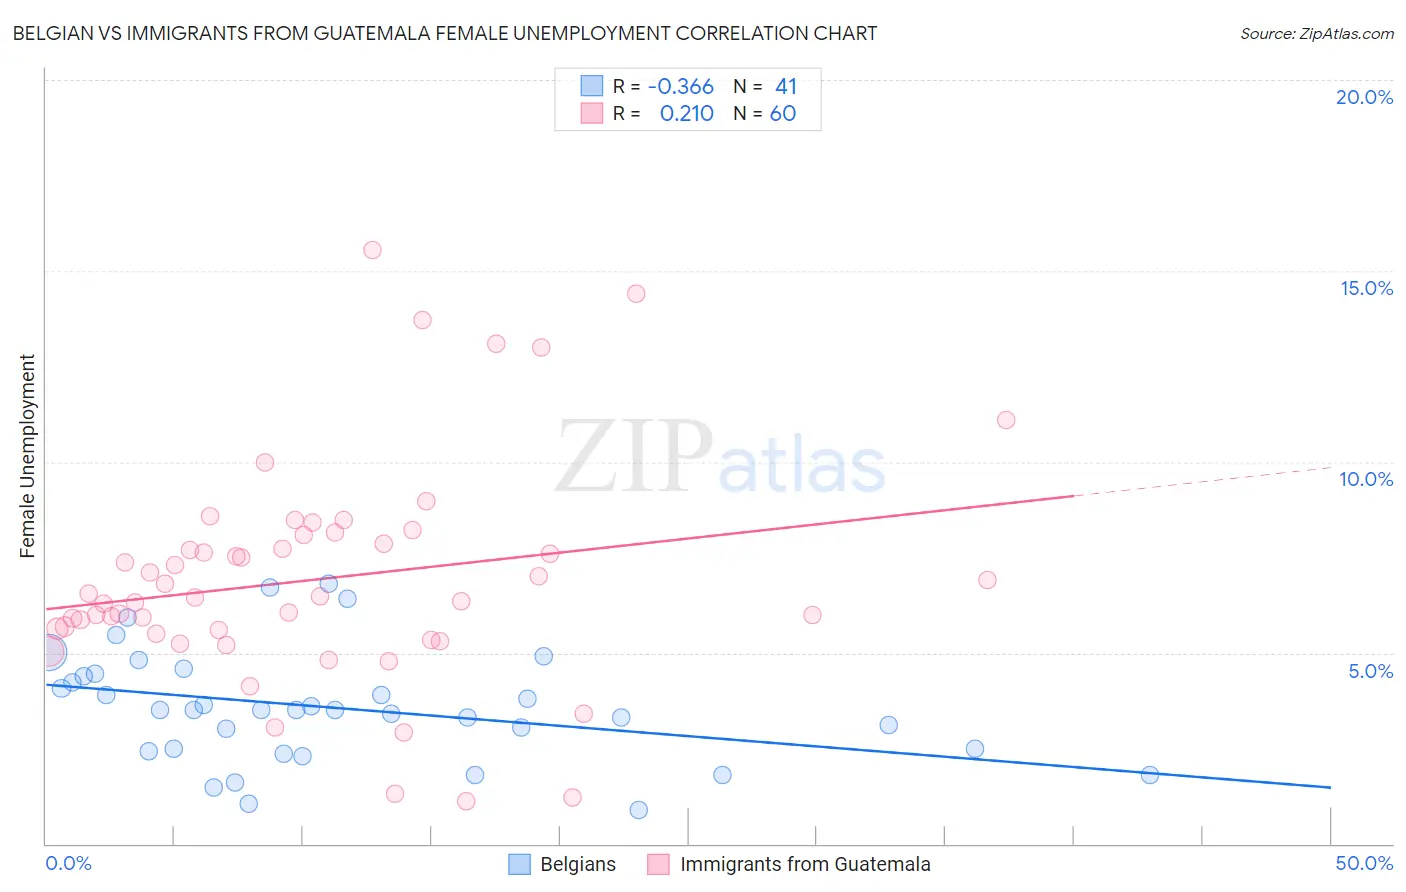
Belgian vs Immigrants from Guatemala Female Unemployment Correlation Chart
The statistical analysis conducted on geographies consisting of 353,426,592 people shows a mild negative correlation between the proportion of Belgians and unemploymnet rate among females in the United States with a correlation coefficient (R) of -0.366 and weighted average of 4.6%. Similarly, the statistical analysis conducted on geographies consisting of 375,756,424 people shows a weak positive correlation between the proportion of Immigrants from Guatemala and unemploymnet rate among females in the United States with a correlation coefficient (R) of 0.210 and weighted average of 6.1%, a difference of 32.3%.
Female Unemployment Correlation Summary
| Measurement | Belgian | Immigrants from Guatemala |
| Minimum | 0.90% | 1.1% |
| Maximum | 6.8% | 15.6% |
| Range | 5.9% | 14.5% |
| Mean | 3.6% | 6.9% |
| Median | 3.5% | 6.5% |
| Interquartile 25% (IQ1) | 2.4% | 5.5% |
| Interquartile 75% (IQ3) | 4.4% | 8.0% |
| Interquartile Range (IQR) | 2.0% | 2.4% |
| Standard Deviation (Sample) | 1.5% | 2.9% |
| Standard Deviation (Population) | 1.4% | 2.9% |
Similar Demographics by Female Unemployment
Demographics Similar to Belgians by Female Unemployment
In terms of female unemployment, the demographic groups most similar to Belgians are Dutch (4.6%, a difference of 0.15%), Finnish (4.6%, a difference of 0.59%), Scandinavian (4.6%, a difference of 0.75%), English (4.6%, a difference of 0.79%), and Swiss (4.6%, a difference of 0.86%).
| Demographics | Rating | Rank | Female Unemployment |
| Swedes | 100.0 /100 | #6 | Exceptional 4.4% |
| Chinese | 100.0 /100 | #7 | Exceptional 4.5% |
| Germans | 100.0 /100 | #8 | Exceptional 4.5% |
| Slovenes | 100.0 /100 | #9 | Exceptional 4.5% |
| Swiss | 100.0 /100 | #10 | Exceptional 4.6% |
| Scandinavians | 100.0 /100 | #11 | Exceptional 4.6% |
| Dutch | 100.0 /100 | #12 | Exceptional 4.6% |
| Belgians | 100.0 /100 | #13 | Exceptional 4.6% |
| Finns | 100.0 /100 | #14 | Exceptional 4.6% |
| English | 100.0 /100 | #15 | Exceptional 4.6% |
| Carpatho Rusyns | 99.9 /100 | #16 | Exceptional 4.7% |
| Croatians | 99.9 /100 | #17 | Exceptional 4.7% |
| Latvians | 99.9 /100 | #18 | Exceptional 4.7% |
| Poles | 99.9 /100 | #19 | Exceptional 4.7% |
| Bulgarians | 99.9 /100 | #20 | Exceptional 4.7% |
Demographics Similar to Immigrants from Guatemala by Female Unemployment
In terms of female unemployment, the demographic groups most similar to Immigrants from Guatemala are Chippewa (6.1%, a difference of 0.030%), Haitian (6.1%, a difference of 0.040%), Immigrants from Cabo Verde (6.1%, a difference of 0.050%), Trinidadian and Tobagonian (6.1%, a difference of 0.050%), and Immigrants from Caribbean (6.1%, a difference of 0.11%).
| Demographics | Rating | Rank | Female Unemployment |
| Mexican American Indians | 0.0 /100 | #280 | Tragic 6.0% |
| Guatemalans | 0.0 /100 | #281 | Tragic 6.0% |
| Colville | 0.0 /100 | #282 | Tragic 6.0% |
| Salvadorans | 0.0 /100 | #283 | Tragic 6.0% |
| Immigrants | Senegal | 0.0 /100 | #284 | Tragic 6.1% |
| Immigrants | Cabo Verde | 0.0 /100 | #285 | Tragic 6.1% |
| Chippewa | 0.0 /100 | #286 | Tragic 6.1% |
| Immigrants | Guatemala | 0.0 /100 | #287 | Tragic 6.1% |
| Haitians | 0.0 /100 | #288 | Tragic 6.1% |
| Trinidadians and Tobagonians | 0.0 /100 | #289 | Tragic 6.1% |
| Immigrants | Caribbean | 0.0 /100 | #290 | Tragic 6.1% |
| Immigrants | West Indies | 0.0 /100 | #291 | Tragic 6.1% |
| Immigrants | Trinidad and Tobago | 0.0 /100 | #292 | Tragic 6.1% |
| Mexicans | 0.0 /100 | #293 | Tragic 6.1% |
| Immigrants | El Salvador | 0.0 /100 | #294 | Tragic 6.1% |