Immigrants from Western Africa vs Immigrants from Guatemala Female Unemployment
COMPARE
Immigrants from Western Africa
Immigrants from Guatemala
Female Unemployment
Female Unemployment Comparison
Immigrants from Western Africa
Immigrants from Guatemala
5.9%
FEMALE UNEMPLOYMENT
0.0/ 100
METRIC RATING
269th/ 347
METRIC RANK
6.1%
FEMALE UNEMPLOYMENT
0.0/ 100
METRIC RATING
287th/ 347
METRIC RANK
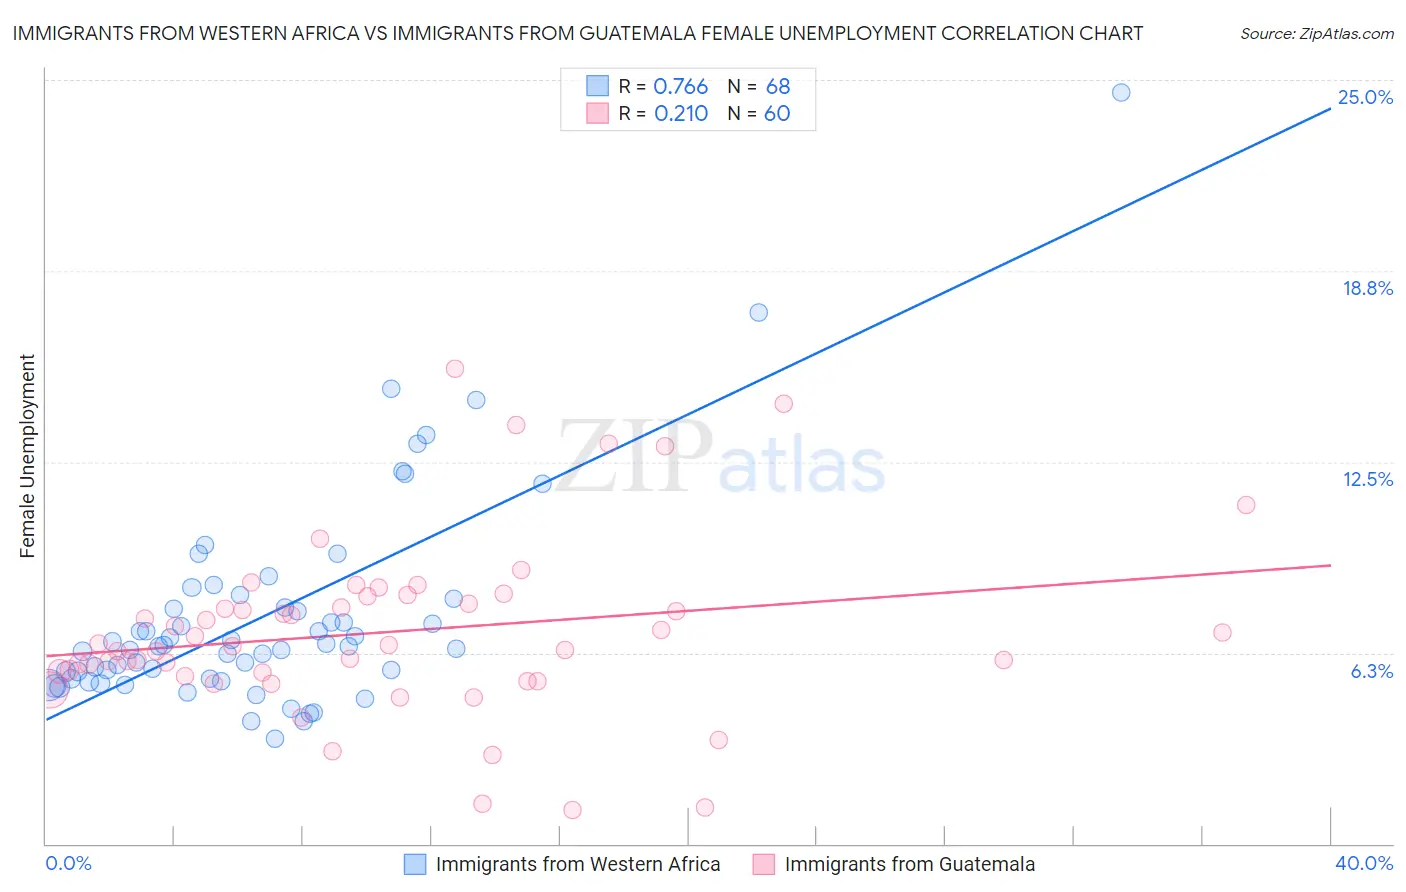
Immigrants from Western Africa vs Immigrants from Guatemala Female Unemployment Correlation Chart
The statistical analysis conducted on geographies consisting of 356,869,554 people shows a strong positive correlation between the proportion of Immigrants from Western Africa and unemploymnet rate among females in the United States with a correlation coefficient (R) of 0.766 and weighted average of 5.9%. Similarly, the statistical analysis conducted on geographies consisting of 375,756,424 people shows a weak positive correlation between the proportion of Immigrants from Guatemala and unemploymnet rate among females in the United States with a correlation coefficient (R) of 0.210 and weighted average of 6.1%, a difference of 3.1%.
Female Unemployment Correlation Summary
| Measurement | Immigrants from Western Africa | Immigrants from Guatemala |
| Minimum | 3.4% | 1.1% |
| Maximum | 24.6% | 15.6% |
| Range | 21.2% | 14.5% |
| Mean | 7.4% | 6.9% |
| Median | 6.5% | 6.5% |
| Interquartile 25% (IQ1) | 5.4% | 5.5% |
| Interquartile 75% (IQ3) | 7.9% | 8.0% |
| Interquartile Range (IQR) | 2.5% | 2.4% |
| Standard Deviation (Sample) | 3.5% | 2.9% |
| Standard Deviation (Population) | 3.5% | 2.9% |
Demographics Similar to Immigrants from Western Africa and Immigrants from Guatemala by Female Unemployment
In terms of female unemployment, the demographic groups most similar to Immigrants from Western Africa are Honduran (5.9%, a difference of 0.20%), Immigrants from Honduras (5.9%, a difference of 0.41%), Central American (5.9%, a difference of 0.51%), Lumbee (5.9%, a difference of 0.70%), and Ghanaian (5.9%, a difference of 0.72%). Similarly, the demographic groups most similar to Immigrants from Guatemala are Chippewa (6.1%, a difference of 0.030%), Haitian (6.1%, a difference of 0.040%), Immigrants from Cabo Verde (6.1%, a difference of 0.050%), Immigrants from Senegal (6.1%, a difference of 0.43%), and Salvadoran (6.0%, a difference of 0.77%).
| Demographics | Rating | Rank | Female Unemployment |
| Hondurans | 0.0 /100 | #268 | Tragic 5.9% |
| Immigrants | Western Africa | 0.0 /100 | #269 | Tragic 5.9% |
| Immigrants | Honduras | 0.0 /100 | #270 | Tragic 5.9% |
| Central Americans | 0.0 /100 | #271 | Tragic 5.9% |
| Lumbee | 0.0 /100 | #272 | Tragic 5.9% |
| Ghanaians | 0.0 /100 | #273 | Tragic 5.9% |
| Africans | 0.0 /100 | #274 | Tragic 5.9% |
| Senegalese | 0.0 /100 | #275 | Tragic 6.0% |
| Bahamians | 0.0 /100 | #276 | Tragic 6.0% |
| Immigrants | Ghana | 0.0 /100 | #277 | Tragic 6.0% |
| Yaqui | 0.0 /100 | #278 | Tragic 6.0% |
| Armenians | 0.0 /100 | #279 | Tragic 6.0% |
| Mexican American Indians | 0.0 /100 | #280 | Tragic 6.0% |
| Guatemalans | 0.0 /100 | #281 | Tragic 6.0% |
| Colville | 0.0 /100 | #282 | Tragic 6.0% |
| Salvadorans | 0.0 /100 | #283 | Tragic 6.0% |
| Immigrants | Senegal | 0.0 /100 | #284 | Tragic 6.1% |
| Immigrants | Cabo Verde | 0.0 /100 | #285 | Tragic 6.1% |
| Chippewa | 0.0 /100 | #286 | Tragic 6.1% |
| Immigrants | Guatemala | 0.0 /100 | #287 | Tragic 6.1% |
| Haitians | 0.0 /100 | #288 | Tragic 6.1% |