Immigrants from Iran vs Immigrants from Guatemala Female Unemployment
COMPARE
Immigrants from Iran
Immigrants from Guatemala
Female Unemployment
Female Unemployment Comparison
Immigrants from Iran
Immigrants from Guatemala
5.5%
FEMALE UNEMPLOYMENT
3.3/ 100
METRIC RATING
235th/ 347
METRIC RANK
6.1%
FEMALE UNEMPLOYMENT
0.0/ 100
METRIC RATING
287th/ 347
METRIC RANK
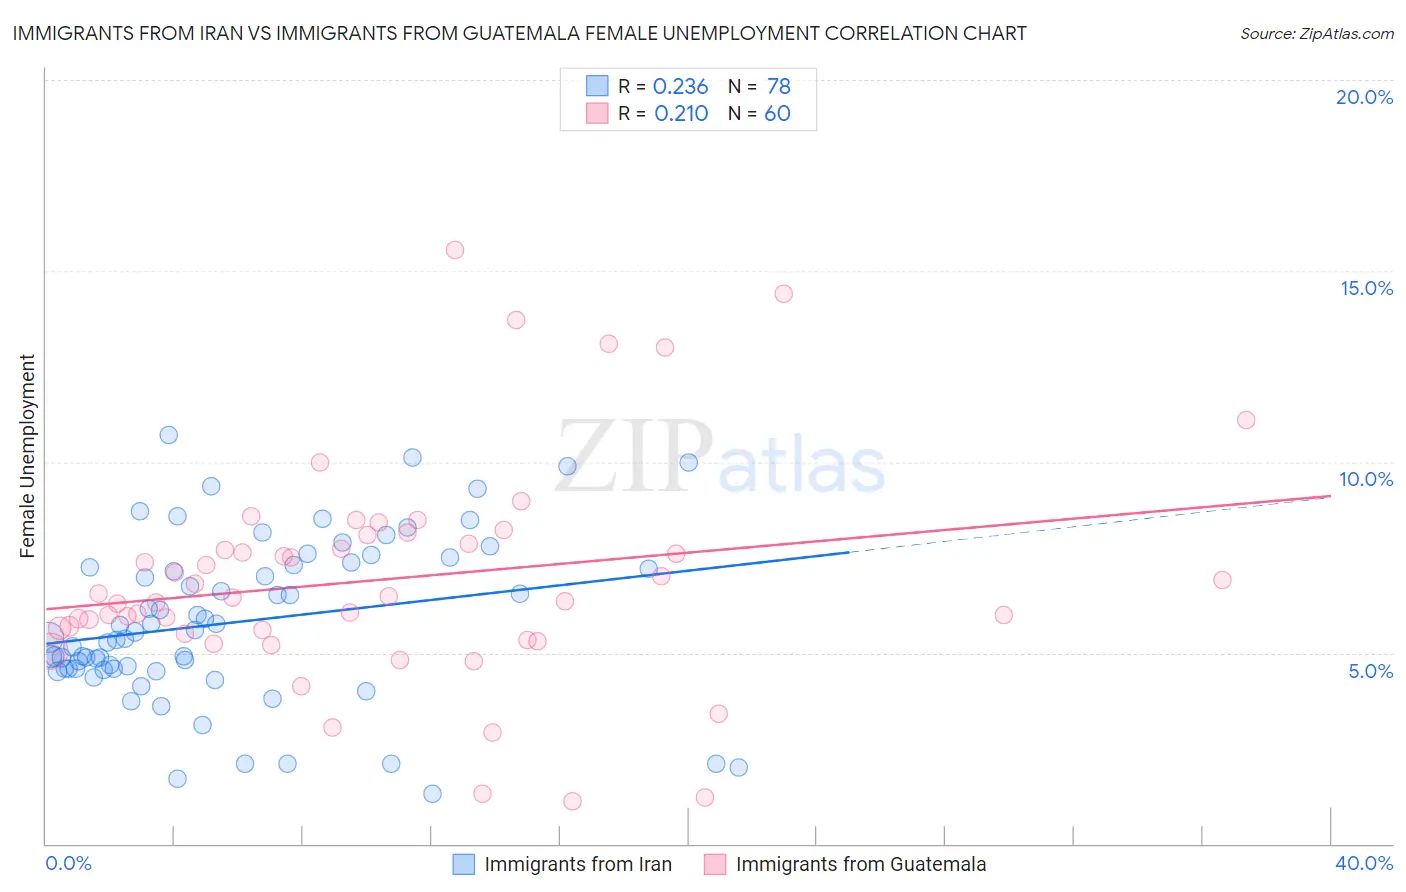
Immigrants from Iran vs Immigrants from Guatemala Female Unemployment Correlation Chart
The statistical analysis conducted on geographies consisting of 279,353,147 people shows a weak positive correlation between the proportion of Immigrants from Iran and unemploymnet rate among females in the United States with a correlation coefficient (R) of 0.236 and weighted average of 5.5%. Similarly, the statistical analysis conducted on geographies consisting of 375,756,424 people shows a weak positive correlation between the proportion of Immigrants from Guatemala and unemploymnet rate among females in the United States with a correlation coefficient (R) of 0.210 and weighted average of 6.1%, a difference of 10.2%.
Female Unemployment Correlation Summary
| Measurement | Immigrants from Iran | Immigrants from Guatemala |
| Minimum | 1.3% | 1.1% |
| Maximum | 10.7% | 15.6% |
| Range | 9.4% | 14.5% |
| Mean | 5.8% | 6.9% |
| Median | 5.5% | 6.5% |
| Interquartile 25% (IQ1) | 4.6% | 5.5% |
| Interquartile 75% (IQ3) | 7.3% | 8.0% |
| Interquartile Range (IQR) | 2.7% | 2.4% |
| Standard Deviation (Sample) | 2.1% | 2.9% |
| Standard Deviation (Population) | 2.1% | 2.9% |
Similar Demographics by Female Unemployment
Demographics Similar to Immigrants from Iran by Female Unemployment
In terms of female unemployment, the demographic groups most similar to Immigrants from Iran are Immigrants from Lebanon (5.5%, a difference of 0.0%), Moroccan (5.5%, a difference of 0.030%), Immigrants from Cambodia (5.5%, a difference of 0.030%), Immigrants from Panama (5.5%, a difference of 0.060%), and Sierra Leonean (5.5%, a difference of 0.080%).
| Demographics | Rating | Rank | Female Unemployment |
| Israelis | 4.8 /100 | #228 | Tragic 5.5% |
| Panamanians | 4.7 /100 | #229 | Tragic 5.5% |
| Immigrants | Uruguay | 4.7 /100 | #230 | Tragic 5.5% |
| Immigrants | Iraq | 3.9 /100 | #231 | Tragic 5.5% |
| Liberians | 3.9 /100 | #232 | Tragic 5.5% |
| Moroccans | 3.4 /100 | #233 | Tragic 5.5% |
| Immigrants | Lebanon | 3.3 /100 | #234 | Tragic 5.5% |
| Immigrants | Iran | 3.3 /100 | #235 | Tragic 5.5% |
| Immigrants | Cambodia | 3.3 /100 | #236 | Tragic 5.5% |
| Immigrants | Panama | 3.2 /100 | #237 | Tragic 5.5% |
| Sierra Leoneans | 3.2 /100 | #238 | Tragic 5.5% |
| Aleuts | 3.0 /100 | #239 | Tragic 5.5% |
| Immigrants | South America | 2.9 /100 | #240 | Tragic 5.5% |
| South American Indians | 2.8 /100 | #241 | Tragic 5.5% |
| Marshallese | 2.3 /100 | #242 | Tragic 5.6% |
Demographics Similar to Immigrants from Guatemala by Female Unemployment
In terms of female unemployment, the demographic groups most similar to Immigrants from Guatemala are Chippewa (6.1%, a difference of 0.030%), Haitian (6.1%, a difference of 0.040%), Immigrants from Cabo Verde (6.1%, a difference of 0.050%), Trinidadian and Tobagonian (6.1%, a difference of 0.050%), and Immigrants from Caribbean (6.1%, a difference of 0.11%).
| Demographics | Rating | Rank | Female Unemployment |
| Mexican American Indians | 0.0 /100 | #280 | Tragic 6.0% |
| Guatemalans | 0.0 /100 | #281 | Tragic 6.0% |
| Colville | 0.0 /100 | #282 | Tragic 6.0% |
| Salvadorans | 0.0 /100 | #283 | Tragic 6.0% |
| Immigrants | Senegal | 0.0 /100 | #284 | Tragic 6.1% |
| Immigrants | Cabo Verde | 0.0 /100 | #285 | Tragic 6.1% |
| Chippewa | 0.0 /100 | #286 | Tragic 6.1% |
| Immigrants | Guatemala | 0.0 /100 | #287 | Tragic 6.1% |
| Haitians | 0.0 /100 | #288 | Tragic 6.1% |
| Trinidadians and Tobagonians | 0.0 /100 | #289 | Tragic 6.1% |
| Immigrants | Caribbean | 0.0 /100 | #290 | Tragic 6.1% |
| Immigrants | West Indies | 0.0 /100 | #291 | Tragic 6.1% |
| Immigrants | Trinidad and Tobago | 0.0 /100 | #292 | Tragic 6.1% |
| Mexicans | 0.0 /100 | #293 | Tragic 6.1% |
| Immigrants | El Salvador | 0.0 /100 | #294 | Tragic 6.1% |