Hmong vs Immigrants from Somalia Unemployment Among Women with Children Under 6 years
COMPARE
Hmong
Immigrants from Somalia
Unemployment Among Women with Children Under 6 years
Unemployment Among Women with Children Under 6 years Comparison
Hmong
Immigrants from Somalia
6.7%
UNEMPLOYMENT AMONG WOMEN WITH CHILDREN UNDER 6 YEARS
100.0/ 100
METRIC RATING
38th/ 347
METRIC RANK
7.1%
UNEMPLOYMENT AMONG WOMEN WITH CHILDREN UNDER 6 YEARS
98.9/ 100
METRIC RATING
78th/ 347
METRIC RANK
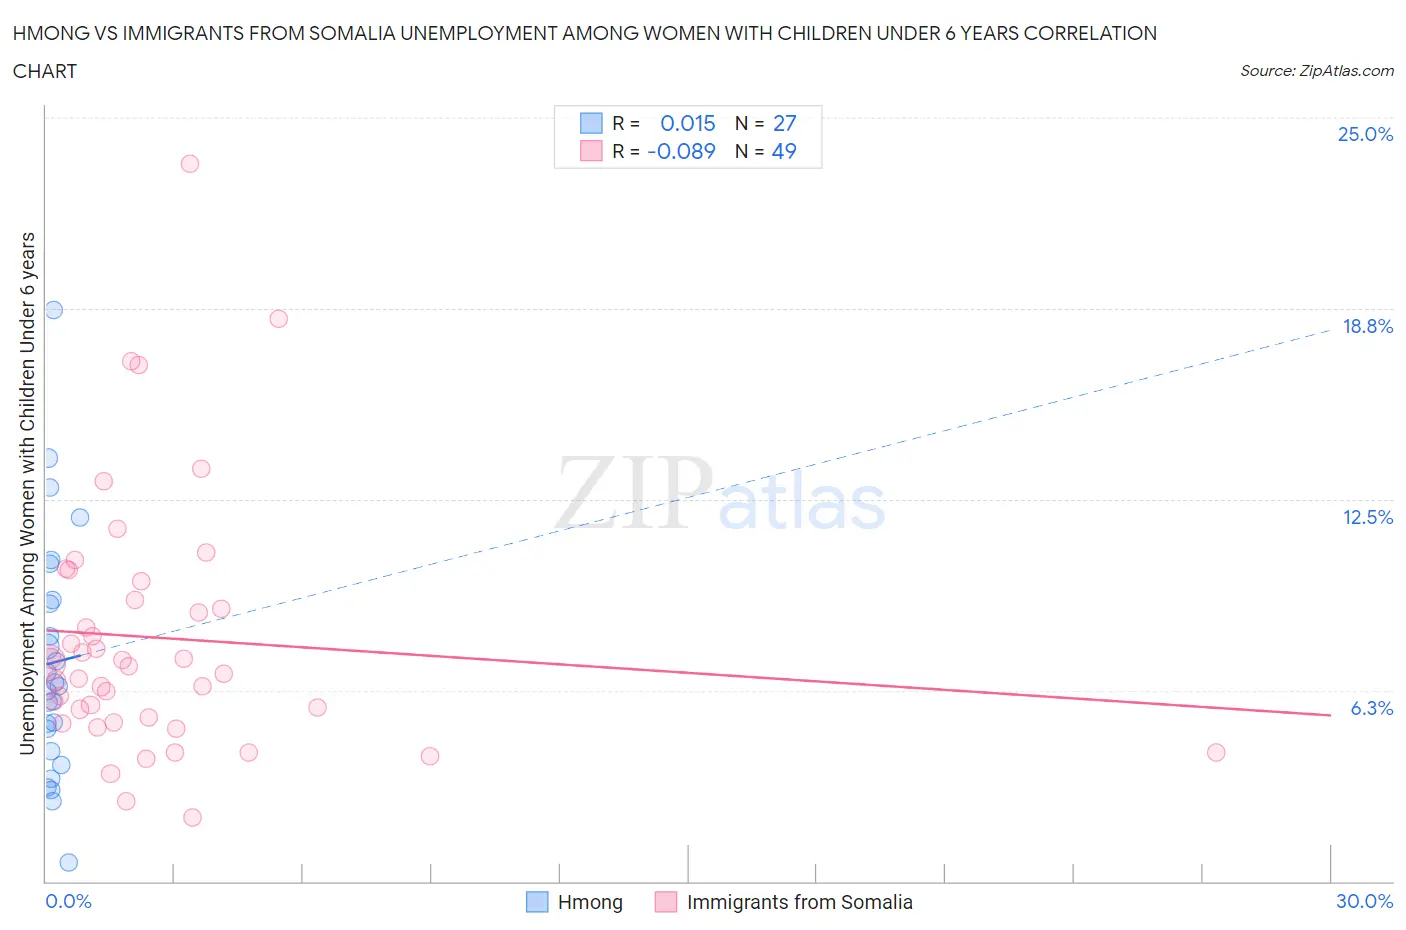
Hmong vs Immigrants from Somalia Unemployment Among Women with Children Under 6 years Correlation Chart
The statistical analysis conducted on geographies consisting of 24,062,767 people shows no correlation between the proportion of Hmong and unemployment rate among women with children under the age of 6 in the United States with a correlation coefficient (R) of 0.015 and weighted average of 6.7%. Similarly, the statistical analysis conducted on geographies consisting of 84,437,163 people shows a slight negative correlation between the proportion of Immigrants from Somalia and unemployment rate among women with children under the age of 6 in the United States with a correlation coefficient (R) of -0.089 and weighted average of 7.1%, a difference of 6.3%.
Unemployment Among Women with Children Under 6 years Correlation Summary
| Measurement | Hmong | Immigrants from Somalia |
| Minimum | 0.60% | 2.1% |
| Maximum | 18.7% | 23.5% |
| Range | 18.1% | 21.4% |
| Mean | 7.2% | 8.0% |
| Median | 6.4% | 7.1% |
| Interquartile 25% (IQ1) | 4.3% | 5.3% |
| Interquartile 75% (IQ3) | 9.2% | 9.5% |
| Interquartile Range (IQR) | 4.9% | 4.2% |
| Standard Deviation (Sample) | 4.0% | 4.2% |
| Standard Deviation (Population) | 3.9% | 4.2% |
Similar Demographics by Unemployment Among Women with Children Under 6 years
Demographics Similar to Hmong by Unemployment Among Women with Children Under 6 years
In terms of unemployment among women with children under 6 years, the demographic groups most similar to Hmong are Immigrants from Russia (6.7%, a difference of 0.060%), Sri Lankan (6.6%, a difference of 0.13%), Asian (6.7%, a difference of 0.28%), Luxembourger (6.6%, a difference of 0.38%), and Immigrants from Indonesia (6.7%, a difference of 0.44%).
| Demographics | Rating | Rank | Unemployment Among Women with Children Under 6 years |
| Immigrants | Moldova | 100.0 /100 | #31 | Exceptional 6.6% |
| Tsimshian | 100.0 /100 | #32 | Exceptional 6.6% |
| Immigrants | Vietnam | 100.0 /100 | #33 | Exceptional 6.6% |
| Immigrants | South Central Asia | 100.0 /100 | #34 | Exceptional 6.6% |
| Yakama | 100.0 /100 | #35 | Exceptional 6.6% |
| Luxembourgers | 100.0 /100 | #36 | Exceptional 6.6% |
| Sri Lankans | 100.0 /100 | #37 | Exceptional 6.6% |
| Hmong | 100.0 /100 | #38 | Exceptional 6.7% |
| Immigrants | Russia | 100.0 /100 | #39 | Exceptional 6.7% |
| Asians | 100.0 /100 | #40 | Exceptional 6.7% |
| Immigrants | Indonesia | 99.9 /100 | #41 | Exceptional 6.7% |
| Immigrants | Cuba | 99.9 /100 | #42 | Exceptional 6.7% |
| Bhutanese | 99.9 /100 | #43 | Exceptional 6.7% |
| Iranians | 99.9 /100 | #44 | Exceptional 6.7% |
| Immigrants | Australia | 99.9 /100 | #45 | Exceptional 6.8% |
Demographics Similar to Immigrants from Somalia by Unemployment Among Women with Children Under 6 years
In terms of unemployment among women with children under 6 years, the demographic groups most similar to Immigrants from Somalia are Immigrants from Croatia (7.1%, a difference of 0.040%), Immigrants from Fiji (7.1%, a difference of 0.050%), Estonian (7.1%, a difference of 0.070%), Immigrants from Greece (7.1%, a difference of 0.070%), and Immigrants from Venezuela (7.1%, a difference of 0.11%).
| Demographics | Rating | Rank | Unemployment Among Women with Children Under 6 years |
| Afghans | 99.4 /100 | #71 | Exceptional 7.0% |
| Cubans | 99.4 /100 | #72 | Exceptional 7.0% |
| Immigrants | Czechoslovakia | 99.2 /100 | #73 | Exceptional 7.0% |
| Turks | 99.2 /100 | #74 | Exceptional 7.0% |
| Immigrants | Eastern Europe | 99.0 /100 | #75 | Exceptional 7.1% |
| Estonians | 99.0 /100 | #76 | Exceptional 7.1% |
| Immigrants | Croatia | 98.9 /100 | #77 | Exceptional 7.1% |
| Immigrants | Somalia | 98.9 /100 | #78 | Exceptional 7.1% |
| Immigrants | Fiji | 98.9 /100 | #79 | Exceptional 7.1% |
| Immigrants | Greece | 98.9 /100 | #80 | Exceptional 7.1% |
| Immigrants | Venezuela | 98.8 /100 | #81 | Exceptional 7.1% |
| Immigrants | Afghanistan | 98.7 /100 | #82 | Exceptional 7.1% |
| Egyptians | 98.7 /100 | #83 | Exceptional 7.1% |
| Immigrants | Albania | 98.7 /100 | #84 | Exceptional 7.1% |
| Immigrants | Romania | 98.7 /100 | #85 | Exceptional 7.1% |