Hmong vs Bulgarian Unemployment Among Women with Children Under 6 years
COMPARE
Hmong
Bulgarian
Unemployment Among Women with Children Under 6 years
Unemployment Among Women with Children Under 6 years Comparison
Hmong
Bulgarians
6.7%
UNEMPLOYMENT AMONG WOMEN WITH CHILDREN UNDER 6 YEARS
100.0/ 100
METRIC RATING
38th/ 347
METRIC RANK
6.5%
UNEMPLOYMENT AMONG WOMEN WITH CHILDREN UNDER 6 YEARS
100.0/ 100
METRIC RATING
23rd/ 347
METRIC RANK
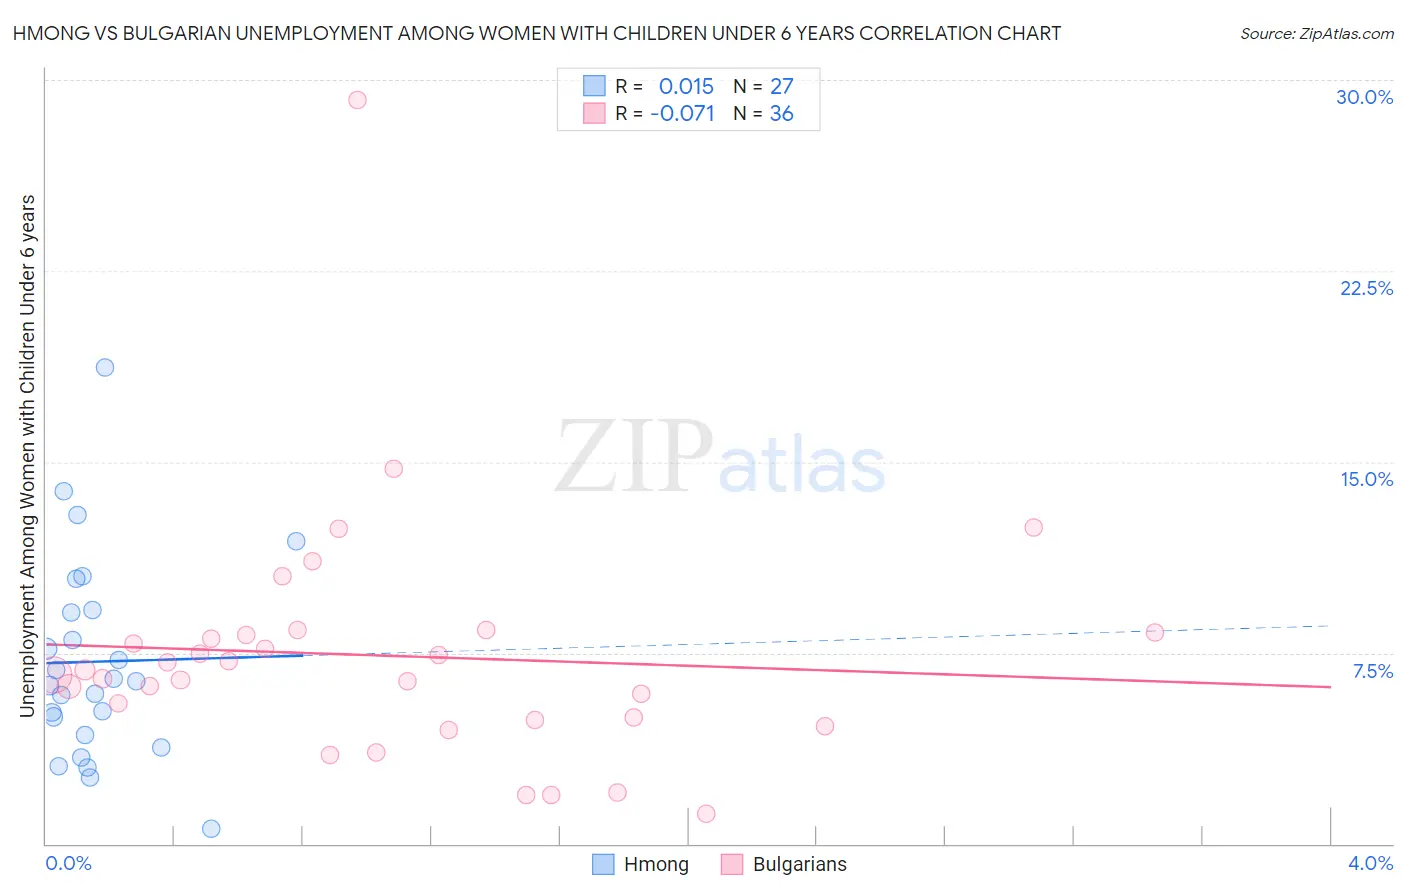
Hmong vs Bulgarian Unemployment Among Women with Children Under 6 years Correlation Chart
The statistical analysis conducted on geographies consisting of 24,062,767 people shows no correlation between the proportion of Hmong and unemployment rate among women with children under the age of 6 in the United States with a correlation coefficient (R) of 0.015 and weighted average of 6.7%. Similarly, the statistical analysis conducted on geographies consisting of 170,221,642 people shows a slight negative correlation between the proportion of Bulgarians and unemployment rate among women with children under the age of 6 in the United States with a correlation coefficient (R) of -0.071 and weighted average of 6.5%, a difference of 2.1%.
Unemployment Among Women with Children Under 6 years Correlation Summary
| Measurement | Hmong | Bulgarian |
| Minimum | 0.60% | 1.2% |
| Maximum | 18.7% | 29.2% |
| Range | 18.1% | 28.0% |
| Mean | 7.2% | 7.4% |
| Median | 6.4% | 6.7% |
| Interquartile 25% (IQ1) | 4.3% | 4.9% |
| Interquartile 75% (IQ3) | 9.2% | 8.3% |
| Interquartile Range (IQR) | 4.9% | 3.4% |
| Standard Deviation (Sample) | 4.0% | 4.8% |
| Standard Deviation (Population) | 3.9% | 4.7% |
Demographics Similar to Hmong and Bulgarians by Unemployment Among Women with Children Under 6 years
In terms of unemployment among women with children under 6 years, the demographic groups most similar to Hmong are Immigrants from Russia (6.7%, a difference of 0.060%), Sri Lankan (6.6%, a difference of 0.13%), Asian (6.7%, a difference of 0.28%), Luxembourger (6.6%, a difference of 0.38%), and Yakama (6.6%, a difference of 0.45%). Similarly, the demographic groups most similar to Bulgarians are Laotian (6.5%, a difference of 0.15%), Soviet Union (6.5%, a difference of 0.16%), Immigrants from Korea (6.5%, a difference of 0.20%), Cypriot (6.5%, a difference of 0.25%), and Immigrants from Japan (6.5%, a difference of 0.35%).
| Demographics | Rating | Rank | Unemployment Among Women with Children Under 6 years |
| Ute | 100.0 /100 | #20 | Exceptional 6.5% |
| Burmese | 100.0 /100 | #21 | Exceptional 6.5% |
| Immigrants | Korea | 100.0 /100 | #22 | Exceptional 6.5% |
| Bulgarians | 100.0 /100 | #23 | Exceptional 6.5% |
| Laotians | 100.0 /100 | #24 | Exceptional 6.5% |
| Soviet Union | 100.0 /100 | #25 | Exceptional 6.5% |
| Cypriots | 100.0 /100 | #26 | Exceptional 6.5% |
| Immigrants | Japan | 100.0 /100 | #27 | Exceptional 6.5% |
| Immigrants | Israel | 100.0 /100 | #28 | Exceptional 6.5% |
| Immigrants | Sweden | 100.0 /100 | #29 | Exceptional 6.6% |
| Immigrants | Belarus | 100.0 /100 | #30 | Exceptional 6.6% |
| Immigrants | Moldova | 100.0 /100 | #31 | Exceptional 6.6% |
| Tsimshian | 100.0 /100 | #32 | Exceptional 6.6% |
| Immigrants | Vietnam | 100.0 /100 | #33 | Exceptional 6.6% |
| Immigrants | South Central Asia | 100.0 /100 | #34 | Exceptional 6.6% |
| Yakama | 100.0 /100 | #35 | Exceptional 6.6% |
| Luxembourgers | 100.0 /100 | #36 | Exceptional 6.6% |
| Sri Lankans | 100.0 /100 | #37 | Exceptional 6.6% |
| Hmong | 100.0 /100 | #38 | Exceptional 6.7% |
| Immigrants | Russia | 100.0 /100 | #39 | Exceptional 6.7% |
| Asians | 100.0 /100 | #40 | Exceptional 6.7% |