Hmong vs Haitian Unemployment Among Women with Children Under 6 years
COMPARE
Hmong
Haitian
Unemployment Among Women with Children Under 6 years
Unemployment Among Women with Children Under 6 years Comparison
Hmong
Haitians
6.7%
UNEMPLOYMENT AMONG WOMEN WITH CHILDREN UNDER 6 YEARS
100.0/ 100
METRIC RATING
38th/ 347
METRIC RANK
8.6%
UNEMPLOYMENT AMONG WOMEN WITH CHILDREN UNDER 6 YEARS
0.0/ 100
METRIC RATING
277th/ 347
METRIC RANK
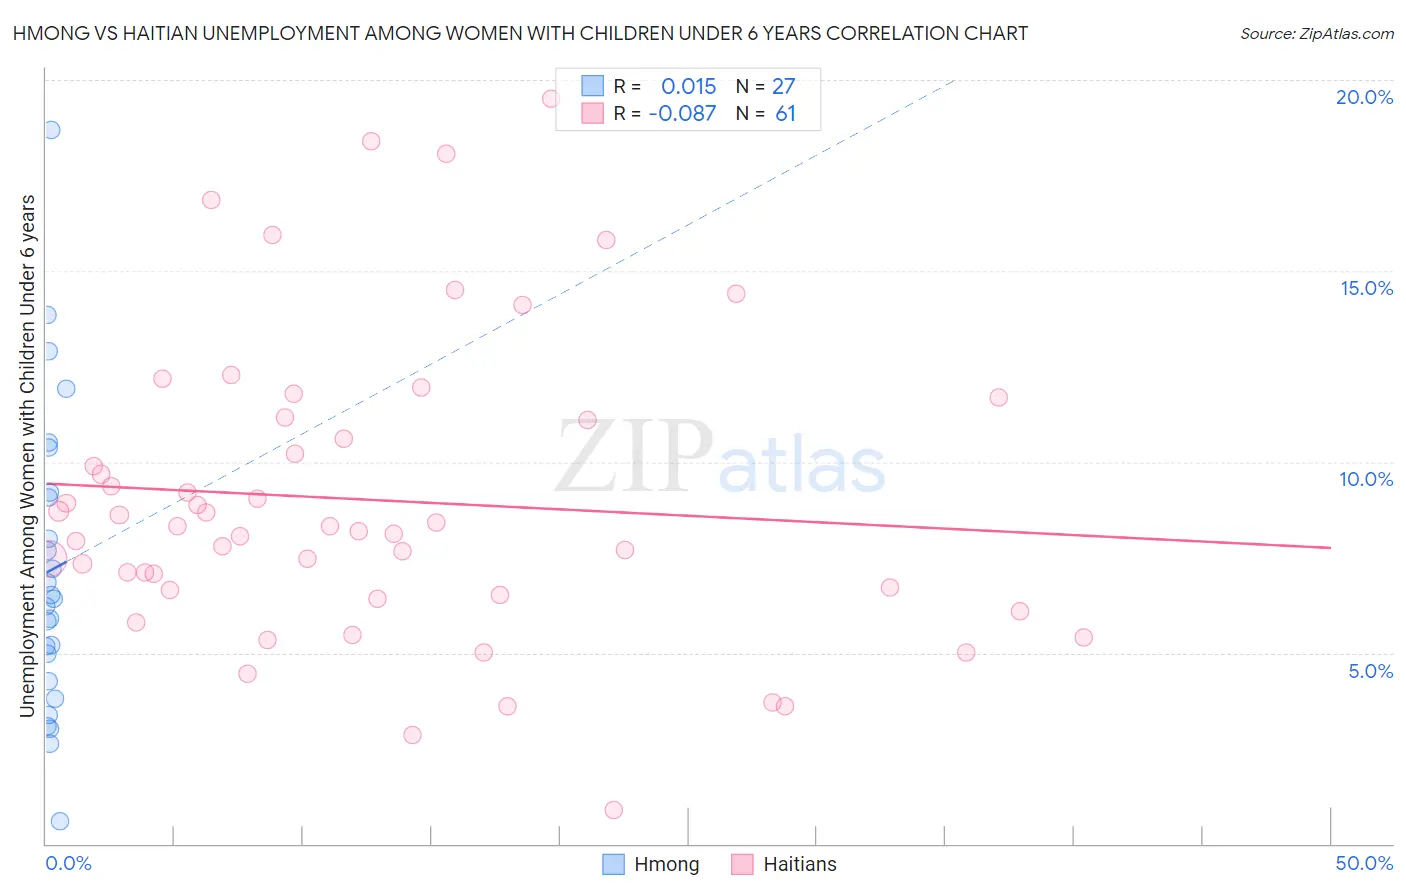
Hmong vs Haitian Unemployment Among Women with Children Under 6 years Correlation Chart
The statistical analysis conducted on geographies consisting of 24,062,767 people shows no correlation between the proportion of Hmong and unemployment rate among women with children under the age of 6 in the United States with a correlation coefficient (R) of 0.015 and weighted average of 6.7%. Similarly, the statistical analysis conducted on geographies consisting of 230,903,570 people shows a slight negative correlation between the proportion of Haitians and unemployment rate among women with children under the age of 6 in the United States with a correlation coefficient (R) of -0.087 and weighted average of 8.6%, a difference of 29.5%.
Unemployment Among Women with Children Under 6 years Correlation Summary
| Measurement | Hmong | Haitian |
| Minimum | 0.60% | 0.90% |
| Maximum | 18.7% | 19.5% |
| Range | 18.1% | 18.6% |
| Mean | 7.2% | 9.0% |
| Median | 6.4% | 8.3% |
| Interquartile 25% (IQ1) | 4.3% | 6.6% |
| Interquartile 75% (IQ3) | 9.2% | 11.1% |
| Interquartile Range (IQR) | 4.9% | 4.6% |
| Standard Deviation (Sample) | 4.0% | 3.9% |
| Standard Deviation (Population) | 3.9% | 3.9% |
Similar Demographics by Unemployment Among Women with Children Under 6 years
Demographics Similar to Hmong by Unemployment Among Women with Children Under 6 years
In terms of unemployment among women with children under 6 years, the demographic groups most similar to Hmong are Immigrants from Russia (6.7%, a difference of 0.060%), Sri Lankan (6.6%, a difference of 0.13%), Asian (6.7%, a difference of 0.28%), Luxembourger (6.6%, a difference of 0.38%), and Immigrants from Indonesia (6.7%, a difference of 0.44%).
| Demographics | Rating | Rank | Unemployment Among Women with Children Under 6 years |
| Immigrants | Moldova | 100.0 /100 | #31 | Exceptional 6.6% |
| Tsimshian | 100.0 /100 | #32 | Exceptional 6.6% |
| Immigrants | Vietnam | 100.0 /100 | #33 | Exceptional 6.6% |
| Immigrants | South Central Asia | 100.0 /100 | #34 | Exceptional 6.6% |
| Yakama | 100.0 /100 | #35 | Exceptional 6.6% |
| Luxembourgers | 100.0 /100 | #36 | Exceptional 6.6% |
| Sri Lankans | 100.0 /100 | #37 | Exceptional 6.6% |
| Hmong | 100.0 /100 | #38 | Exceptional 6.7% |
| Immigrants | Russia | 100.0 /100 | #39 | Exceptional 6.7% |
| Asians | 100.0 /100 | #40 | Exceptional 6.7% |
| Immigrants | Indonesia | 99.9 /100 | #41 | Exceptional 6.7% |
| Immigrants | Cuba | 99.9 /100 | #42 | Exceptional 6.7% |
| Bhutanese | 99.9 /100 | #43 | Exceptional 6.7% |
| Iranians | 99.9 /100 | #44 | Exceptional 6.7% |
| Immigrants | Australia | 99.9 /100 | #45 | Exceptional 6.8% |
Demographics Similar to Haitians by Unemployment Among Women with Children Under 6 years
In terms of unemployment among women with children under 6 years, the demographic groups most similar to Haitians are Yaqui (8.6%, a difference of 0.10%), Immigrants from Dominica (8.6%, a difference of 0.28%), Immigrants from Guatemala (8.6%, a difference of 0.29%), Immigrants from Belize (8.6%, a difference of 0.33%), and Immigrants from Latin America (8.6%, a difference of 0.45%).
| Demographics | Rating | Rank | Unemployment Among Women with Children Under 6 years |
| Immigrants | Senegal | 0.2 /100 | #270 | Tragic 8.5% |
| Immigrants | Congo | 0.2 /100 | #271 | Tragic 8.5% |
| Mexican American Indians | 0.1 /100 | #272 | Tragic 8.5% |
| Slovaks | 0.1 /100 | #273 | Tragic 8.5% |
| Immigrants | Cameroon | 0.1 /100 | #274 | Tragic 8.6% |
| Immigrants | Latin America | 0.1 /100 | #275 | Tragic 8.6% |
| Yaqui | 0.0 /100 | #276 | Tragic 8.6% |
| Haitians | 0.0 /100 | #277 | Tragic 8.6% |
| Immigrants | Dominica | 0.0 /100 | #278 | Tragic 8.6% |
| Immigrants | Guatemala | 0.0 /100 | #279 | Tragic 8.6% |
| Immigrants | Belize | 0.0 /100 | #280 | Tragic 8.6% |
| Guatemalans | 0.0 /100 | #281 | Tragic 8.7% |
| Bermudans | 0.0 /100 | #282 | Tragic 8.7% |
| Spanish American Indians | 0.0 /100 | #283 | Tragic 8.7% |
| Blackfeet | 0.0 /100 | #284 | Tragic 8.7% |