Maltese vs Bulgarian Unemployment Among Women with Children Under 6 years
COMPARE
Maltese
Bulgarian
Unemployment Among Women with Children Under 6 years
Unemployment Among Women with Children Under 6 years Comparison
Maltese
Bulgarians
6.9%
UNEMPLOYMENT AMONG WOMEN WITH CHILDREN UNDER 6 YEARS
99.7/ 100
METRIC RATING
63rd/ 347
METRIC RANK
6.5%
UNEMPLOYMENT AMONG WOMEN WITH CHILDREN UNDER 6 YEARS
100.0/ 100
METRIC RATING
23rd/ 347
METRIC RANK
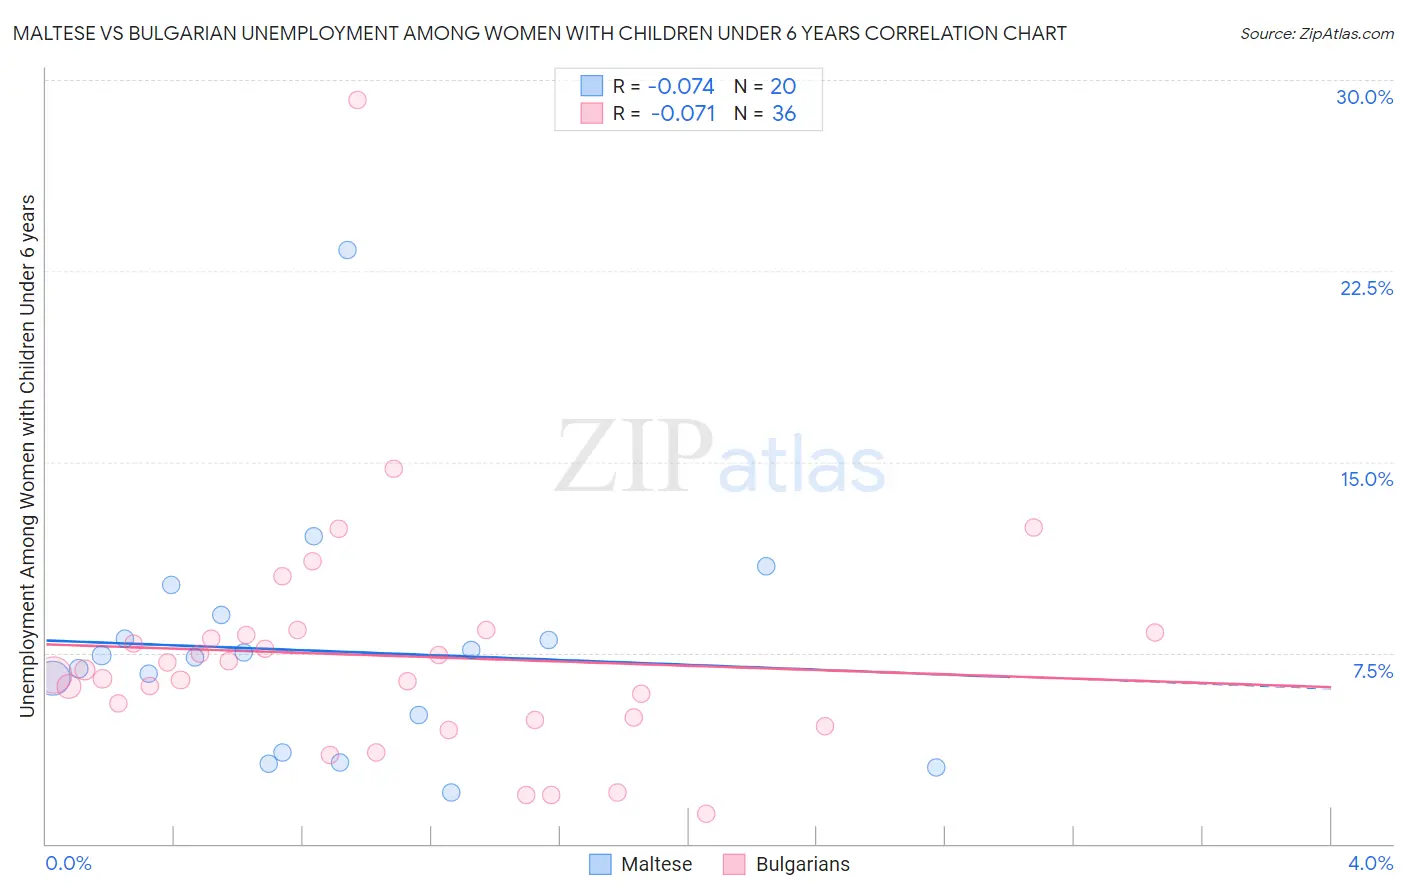
Maltese vs Bulgarian Unemployment Among Women with Children Under 6 years Correlation Chart
The statistical analysis conducted on geographies consisting of 109,228,269 people shows a slight negative correlation between the proportion of Maltese and unemployment rate among women with children under the age of 6 in the United States with a correlation coefficient (R) of -0.074 and weighted average of 6.9%. Similarly, the statistical analysis conducted on geographies consisting of 170,221,642 people shows a slight negative correlation between the proportion of Bulgarians and unemployment rate among women with children under the age of 6 in the United States with a correlation coefficient (R) of -0.071 and weighted average of 6.5%, a difference of 5.9%.
Unemployment Among Women with Children Under 6 years Correlation Summary
| Measurement | Maltese | Bulgarian |
| Minimum | 2.0% | 1.2% |
| Maximum | 23.3% | 29.2% |
| Range | 21.3% | 28.0% |
| Mean | 7.6% | 7.4% |
| Median | 7.4% | 6.7% |
| Interquartile 25% (IQ1) | 4.3% | 4.9% |
| Interquartile 75% (IQ3) | 8.5% | 8.3% |
| Interquartile Range (IQR) | 4.2% | 3.4% |
| Standard Deviation (Sample) | 4.6% | 4.8% |
| Standard Deviation (Population) | 4.5% | 4.7% |
Similar Demographics by Unemployment Among Women with Children Under 6 years
Demographics Similar to Maltese by Unemployment Among Women with Children Under 6 years
In terms of unemployment among women with children under 6 years, the demographic groups most similar to Maltese are Somali (6.9%, a difference of 0.050%), Immigrants from France (6.9%, a difference of 0.090%), Tongan (6.9%, a difference of 0.10%), Immigrants from Kuwait (6.9%, a difference of 0.25%), and Immigrants from Sri Lanka (6.9%, a difference of 0.46%).
| Demographics | Rating | Rank | Unemployment Among Women with Children Under 6 years |
| Immigrants | Ethiopia | 99.8 /100 | #56 | Exceptional 6.9% |
| Icelanders | 99.8 /100 | #57 | Exceptional 6.9% |
| Immigrants | Turkey | 99.8 /100 | #58 | Exceptional 6.9% |
| Immigrants | Serbia | 99.8 /100 | #59 | Exceptional 6.9% |
| Immigrants | Sri Lanka | 99.8 /100 | #60 | Exceptional 6.9% |
| Immigrants | France | 99.7 /100 | #61 | Exceptional 6.9% |
| Somalis | 99.7 /100 | #62 | Exceptional 6.9% |
| Maltese | 99.7 /100 | #63 | Exceptional 6.9% |
| Tongans | 99.7 /100 | #64 | Exceptional 6.9% |
| Immigrants | Kuwait | 99.7 /100 | #65 | Exceptional 6.9% |
| Immigrants | Belgium | 99.6 /100 | #66 | Exceptional 6.9% |
| Immigrants | Netherlands | 99.5 /100 | #67 | Exceptional 7.0% |
| Paraguayans | 99.4 /100 | #68 | Exceptional 7.0% |
| Immigrants | Eritrea | 99.4 /100 | #69 | Exceptional 7.0% |
| Immigrants | Iraq | 99.4 /100 | #70 | Exceptional 7.0% |
Demographics Similar to Bulgarians by Unemployment Among Women with Children Under 6 years
In terms of unemployment among women with children under 6 years, the demographic groups most similar to Bulgarians are Laotian (6.5%, a difference of 0.15%), Soviet Union (6.5%, a difference of 0.16%), Immigrants from Korea (6.5%, a difference of 0.20%), Cypriot (6.5%, a difference of 0.25%), and Immigrants from Japan (6.5%, a difference of 0.35%).
| Demographics | Rating | Rank | Unemployment Among Women with Children Under 6 years |
| Immigrants | Uzbekistan | 100.0 /100 | #16 | Exceptional 6.3% |
| Immigrants | Malaysia | 100.0 /100 | #17 | Exceptional 6.4% |
| Assyrians/Chaldeans/Syriacs | 100.0 /100 | #18 | Exceptional 6.5% |
| Mongolians | 100.0 /100 | #19 | Exceptional 6.5% |
| Ute | 100.0 /100 | #20 | Exceptional 6.5% |
| Burmese | 100.0 /100 | #21 | Exceptional 6.5% |
| Immigrants | Korea | 100.0 /100 | #22 | Exceptional 6.5% |
| Bulgarians | 100.0 /100 | #23 | Exceptional 6.5% |
| Laotians | 100.0 /100 | #24 | Exceptional 6.5% |
| Soviet Union | 100.0 /100 | #25 | Exceptional 6.5% |
| Cypriots | 100.0 /100 | #26 | Exceptional 6.5% |
| Immigrants | Japan | 100.0 /100 | #27 | Exceptional 6.5% |
| Immigrants | Israel | 100.0 /100 | #28 | Exceptional 6.5% |
| Immigrants | Sweden | 100.0 /100 | #29 | Exceptional 6.6% |
| Immigrants | Belarus | 100.0 /100 | #30 | Exceptional 6.6% |