Immigrants from Central America vs Bulgarian Unemployment Among Women with Children Under 6 years
COMPARE
Immigrants from Central America
Bulgarian
Unemployment Among Women with Children Under 6 years
Unemployment Among Women with Children Under 6 years Comparison
Immigrants from Central America
Bulgarians
8.9%
UNEMPLOYMENT AMONG WOMEN WITH CHILDREN UNDER 6 YEARS
0.0/ 100
METRIC RATING
295th/ 347
METRIC RANK
6.5%
UNEMPLOYMENT AMONG WOMEN WITH CHILDREN UNDER 6 YEARS
100.0/ 100
METRIC RATING
23rd/ 347
METRIC RANK
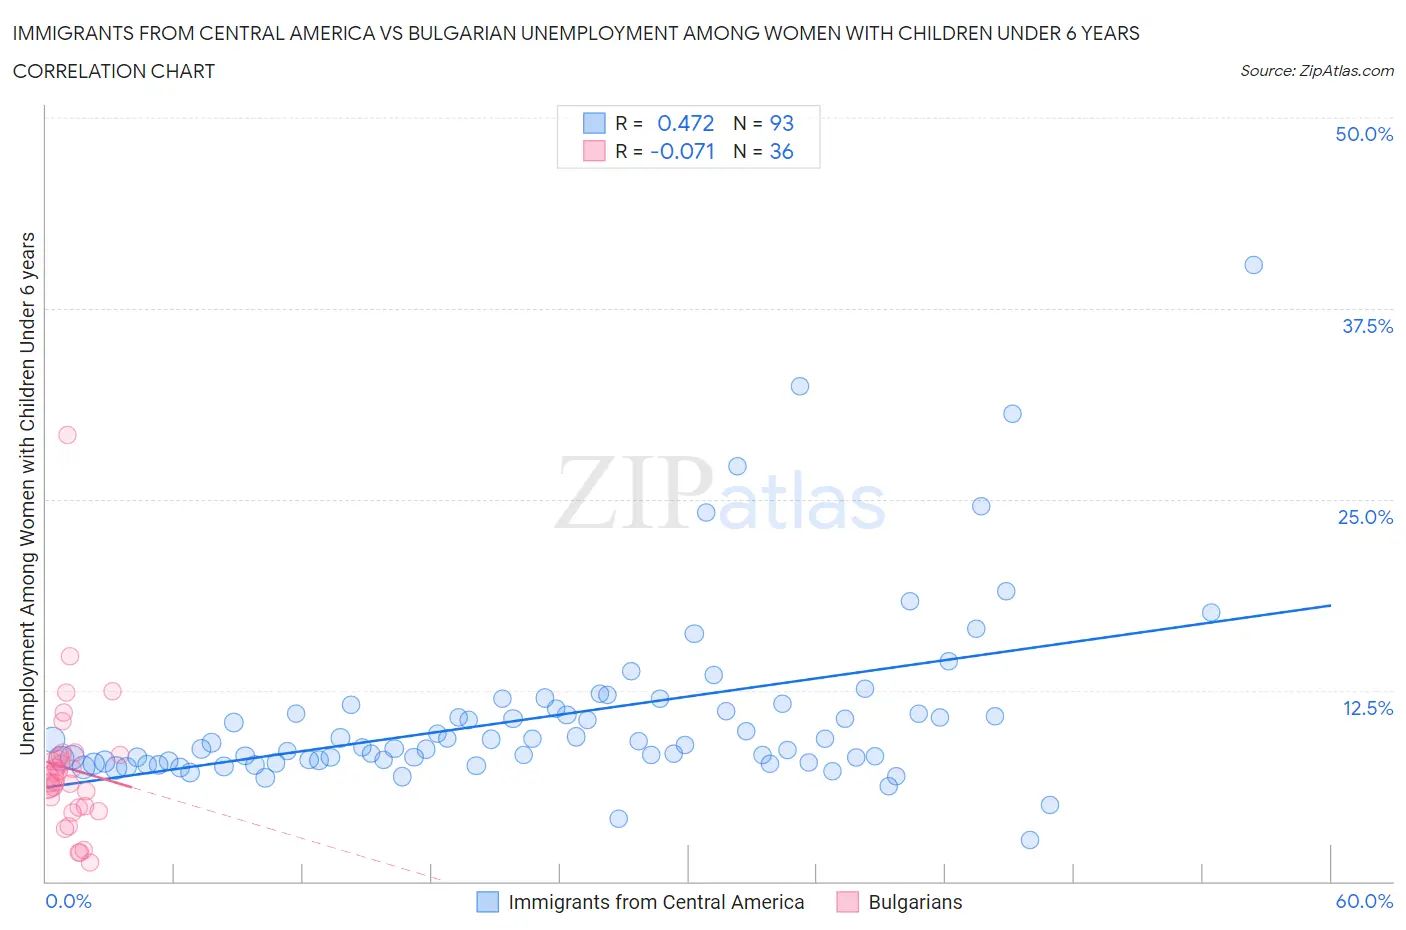
Immigrants from Central America vs Bulgarian Unemployment Among Women with Children Under 6 years Correlation Chart
The statistical analysis conducted on geographies consisting of 368,932,426 people shows a moderate positive correlation between the proportion of Immigrants from Central America and unemployment rate among women with children under the age of 6 in the United States with a correlation coefficient (R) of 0.472 and weighted average of 8.9%. Similarly, the statistical analysis conducted on geographies consisting of 170,221,642 people shows a slight negative correlation between the proportion of Bulgarians and unemployment rate among women with children under the age of 6 in the United States with a correlation coefficient (R) of -0.071 and weighted average of 6.5%, a difference of 35.8%.
Unemployment Among Women with Children Under 6 years Correlation Summary
| Measurement | Immigrants from Central America | Bulgarian |
| Minimum | 2.7% | 1.2% |
| Maximum | 40.4% | 29.2% |
| Range | 37.7% | 28.0% |
| Mean | 10.8% | 7.4% |
| Median | 8.9% | 6.7% |
| Interquartile 25% (IQ1) | 7.8% | 4.9% |
| Interquartile 75% (IQ3) | 11.2% | 8.3% |
| Interquartile Range (IQR) | 3.4% | 3.4% |
| Standard Deviation (Sample) | 5.9% | 4.8% |
| Standard Deviation (Population) | 5.9% | 4.7% |
Similar Demographics by Unemployment Among Women with Children Under 6 years
Demographics Similar to Immigrants from Central America by Unemployment Among Women with Children Under 6 years
In terms of unemployment among women with children under 6 years, the demographic groups most similar to Immigrants from Central America are Nonimmigrants (8.8%, a difference of 0.050%), Immigrants from Dominican Republic (8.9%, a difference of 0.13%), Immigrants from Bangladesh (8.8%, a difference of 0.23%), Mexican (8.9%, a difference of 0.23%), and Tlingit-Haida (8.9%, a difference of 0.39%).
| Demographics | Rating | Rank | Unemployment Among Women with Children Under 6 years |
| Bahamians | 0.0 /100 | #288 | Tragic 8.7% |
| Iroquois | 0.0 /100 | #289 | Tragic 8.7% |
| Vietnamese | 0.0 /100 | #290 | Tragic 8.8% |
| Jamaicans | 0.0 /100 | #291 | Tragic 8.8% |
| Cheyenne | 0.0 /100 | #292 | Tragic 8.8% |
| Immigrants | Bangladesh | 0.0 /100 | #293 | Tragic 8.8% |
| Immigrants | Nonimmigrants | 0.0 /100 | #294 | Tragic 8.8% |
| Immigrants | Central America | 0.0 /100 | #295 | Tragic 8.9% |
| Immigrants | Dominican Republic | 0.0 /100 | #296 | Tragic 8.9% |
| Mexicans | 0.0 /100 | #297 | Tragic 8.9% |
| Tlingit-Haida | 0.0 /100 | #298 | Tragic 8.9% |
| Immigrants | Jamaica | 0.0 /100 | #299 | Tragic 8.9% |
| Creek | 0.0 /100 | #300 | Tragic 8.9% |
| Chickasaw | 0.0 /100 | #301 | Tragic 9.0% |
| Hispanics or Latinos | 0.0 /100 | #302 | Tragic 9.0% |
Demographics Similar to Bulgarians by Unemployment Among Women with Children Under 6 years
In terms of unemployment among women with children under 6 years, the demographic groups most similar to Bulgarians are Laotian (6.5%, a difference of 0.15%), Soviet Union (6.5%, a difference of 0.16%), Immigrants from Korea (6.5%, a difference of 0.20%), Cypriot (6.5%, a difference of 0.25%), and Immigrants from Japan (6.5%, a difference of 0.35%).
| Demographics | Rating | Rank | Unemployment Among Women with Children Under 6 years |
| Immigrants | Uzbekistan | 100.0 /100 | #16 | Exceptional 6.3% |
| Immigrants | Malaysia | 100.0 /100 | #17 | Exceptional 6.4% |
| Assyrians/Chaldeans/Syriacs | 100.0 /100 | #18 | Exceptional 6.5% |
| Mongolians | 100.0 /100 | #19 | Exceptional 6.5% |
| Ute | 100.0 /100 | #20 | Exceptional 6.5% |
| Burmese | 100.0 /100 | #21 | Exceptional 6.5% |
| Immigrants | Korea | 100.0 /100 | #22 | Exceptional 6.5% |
| Bulgarians | 100.0 /100 | #23 | Exceptional 6.5% |
| Laotians | 100.0 /100 | #24 | Exceptional 6.5% |
| Soviet Union | 100.0 /100 | #25 | Exceptional 6.5% |
| Cypriots | 100.0 /100 | #26 | Exceptional 6.5% |
| Immigrants | Japan | 100.0 /100 | #27 | Exceptional 6.5% |
| Immigrants | Israel | 100.0 /100 | #28 | Exceptional 6.5% |
| Immigrants | Sweden | 100.0 /100 | #29 | Exceptional 6.6% |
| Immigrants | Belarus | 100.0 /100 | #30 | Exceptional 6.6% |