Immigrants from Iran vs Bulgarian Unemployment Among Women with Children Under 6 years
COMPARE
Immigrants from Iran
Bulgarian
Unemployment Among Women with Children Under 6 years
Unemployment Among Women with Children Under 6 years Comparison
Immigrants from Iran
Bulgarians
6.8%
UNEMPLOYMENT AMONG WOMEN WITH CHILDREN UNDER 6 YEARS
99.9/ 100
METRIC RATING
52nd/ 347
METRIC RANK
6.5%
UNEMPLOYMENT AMONG WOMEN WITH CHILDREN UNDER 6 YEARS
100.0/ 100
METRIC RATING
23rd/ 347
METRIC RANK
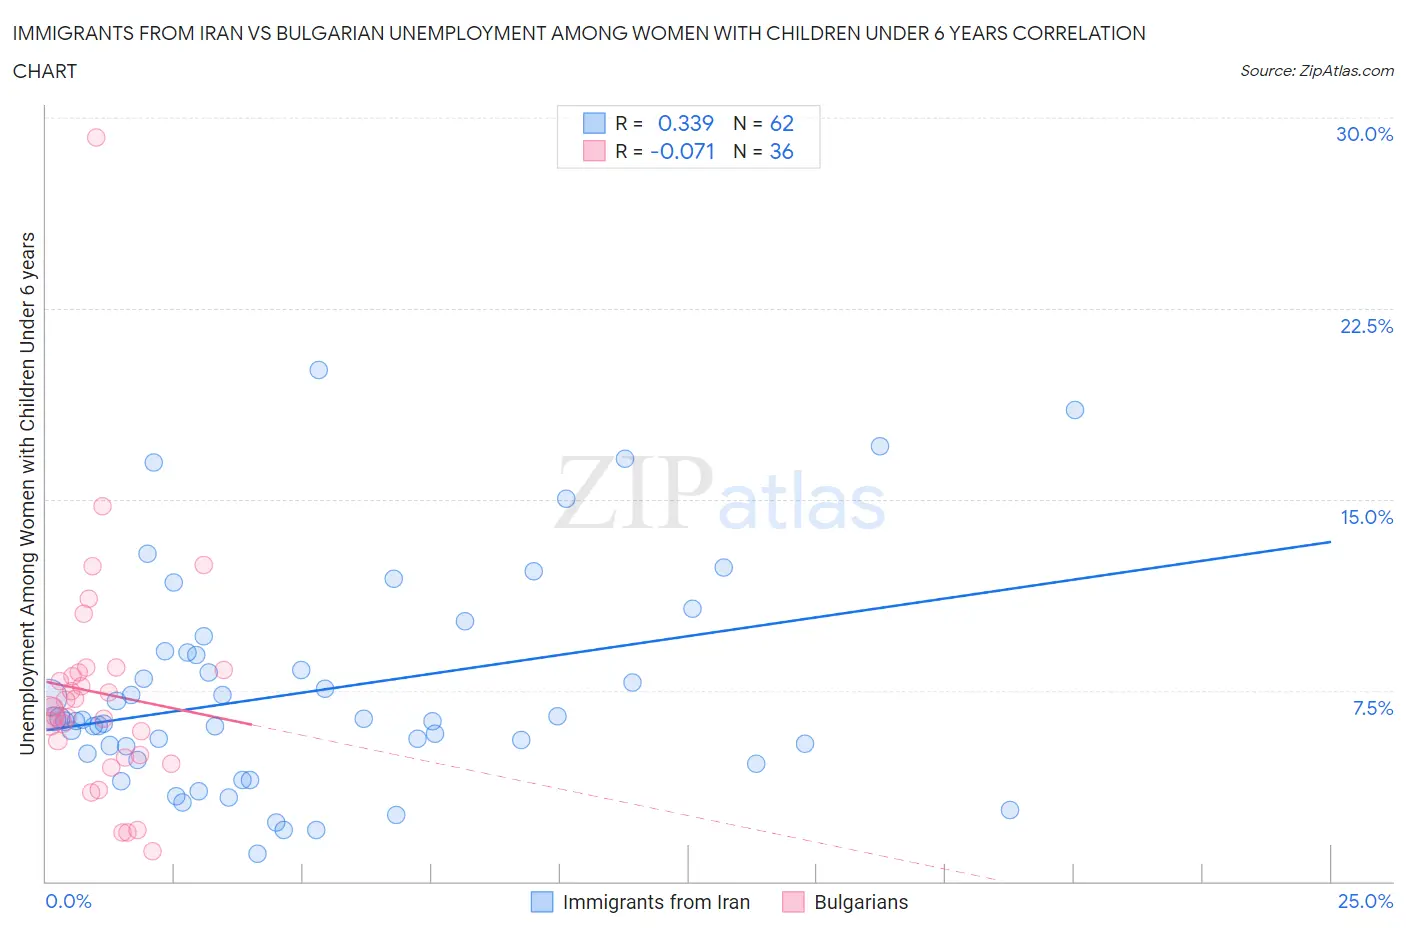
Immigrants from Iran vs Bulgarian Unemployment Among Women with Children Under 6 years Correlation Chart
The statistical analysis conducted on geographies consisting of 227,826,017 people shows a mild positive correlation between the proportion of Immigrants from Iran and unemployment rate among women with children under the age of 6 in the United States with a correlation coefficient (R) of 0.339 and weighted average of 6.8%. Similarly, the statistical analysis conducted on geographies consisting of 170,221,642 people shows a slight negative correlation between the proportion of Bulgarians and unemployment rate among women with children under the age of 6 in the United States with a correlation coefficient (R) of -0.071 and weighted average of 6.5%, a difference of 4.2%.
Unemployment Among Women with Children Under 6 years Correlation Summary
| Measurement | Immigrants from Iran | Bulgarian |
| Minimum | 1.1% | 1.2% |
| Maximum | 20.1% | 29.2% |
| Range | 19.0% | 28.0% |
| Mean | 7.5% | 7.4% |
| Median | 6.3% | 6.7% |
| Interquartile 25% (IQ1) | 5.0% | 4.9% |
| Interquartile 75% (IQ3) | 9.0% | 8.3% |
| Interquartile Range (IQR) | 4.0% | 3.4% |
| Standard Deviation (Sample) | 4.2% | 4.8% |
| Standard Deviation (Population) | 4.2% | 4.7% |
Similar Demographics by Unemployment Among Women with Children Under 6 years
Demographics Similar to Immigrants from Iran by Unemployment Among Women with Children Under 6 years
In terms of unemployment among women with children under 6 years, the demographic groups most similar to Immigrants from Iran are Chinese (6.8%, a difference of 0.070%), Ethiopian (6.8%, a difference of 0.11%), Immigrants from Ireland (6.8%, a difference of 0.13%), Immigrants from Nepal (6.8%, a difference of 0.14%), and Immigrants from Switzerland (6.8%, a difference of 0.19%).
| Demographics | Rating | Rank | Unemployment Among Women with Children Under 6 years |
| Immigrants | Australia | 99.9 /100 | #45 | Exceptional 6.8% |
| Latvians | 99.9 /100 | #46 | Exceptional 6.8% |
| Immigrants | Asia | 99.9 /100 | #47 | Exceptional 6.8% |
| Immigrants | Switzerland | 99.9 /100 | #48 | Exceptional 6.8% |
| Immigrants | Nepal | 99.9 /100 | #49 | Exceptional 6.8% |
| Immigrants | Ireland | 99.9 /100 | #50 | Exceptional 6.8% |
| Ethiopians | 99.9 /100 | #51 | Exceptional 6.8% |
| Immigrants | Iran | 99.9 /100 | #52 | Exceptional 6.8% |
| Chinese | 99.9 /100 | #53 | Exceptional 6.8% |
| Immigrants | Latvia | 99.9 /100 | #54 | Exceptional 6.8% |
| Immigrants | Ukraine | 99.8 /100 | #55 | Exceptional 6.8% |
| Immigrants | Ethiopia | 99.8 /100 | #56 | Exceptional 6.9% |
| Icelanders | 99.8 /100 | #57 | Exceptional 6.9% |
| Immigrants | Turkey | 99.8 /100 | #58 | Exceptional 6.9% |
| Immigrants | Serbia | 99.8 /100 | #59 | Exceptional 6.9% |
Demographics Similar to Bulgarians by Unemployment Among Women with Children Under 6 years
In terms of unemployment among women with children under 6 years, the demographic groups most similar to Bulgarians are Laotian (6.5%, a difference of 0.15%), Soviet Union (6.5%, a difference of 0.16%), Immigrants from Korea (6.5%, a difference of 0.20%), Cypriot (6.5%, a difference of 0.25%), and Immigrants from Japan (6.5%, a difference of 0.35%).
| Demographics | Rating | Rank | Unemployment Among Women with Children Under 6 years |
| Immigrants | Uzbekistan | 100.0 /100 | #16 | Exceptional 6.3% |
| Immigrants | Malaysia | 100.0 /100 | #17 | Exceptional 6.4% |
| Assyrians/Chaldeans/Syriacs | 100.0 /100 | #18 | Exceptional 6.5% |
| Mongolians | 100.0 /100 | #19 | Exceptional 6.5% |
| Ute | 100.0 /100 | #20 | Exceptional 6.5% |
| Burmese | 100.0 /100 | #21 | Exceptional 6.5% |
| Immigrants | Korea | 100.0 /100 | #22 | Exceptional 6.5% |
| Bulgarians | 100.0 /100 | #23 | Exceptional 6.5% |
| Laotians | 100.0 /100 | #24 | Exceptional 6.5% |
| Soviet Union | 100.0 /100 | #25 | Exceptional 6.5% |
| Cypriots | 100.0 /100 | #26 | Exceptional 6.5% |
| Immigrants | Japan | 100.0 /100 | #27 | Exceptional 6.5% |
| Immigrants | Israel | 100.0 /100 | #28 | Exceptional 6.5% |
| Immigrants | Sweden | 100.0 /100 | #29 | Exceptional 6.6% |
| Immigrants | Belarus | 100.0 /100 | #30 | Exceptional 6.6% |