Hispanic or Latino vs Celtic Married-couple Households

COMPARE

Hispanic or Latino
Race
Ancestry
AfghanAfricanAlaska NativeAlaskan AthabascanAlbanianAleutAlsatianAmericanApacheArabArapahoArgentineanArmenianAssyrian/Chaldean/SyriacAustralianAustrianBahamianBangladeshiBarbadianBasqueBelgianBelizeanBermudanBhutaneseBlackfeetBolivianBrazilianBritishBritish West IndianBulgarianBurmeseCajunCambodianCanadianCape VerdeanCarpatho RusynCentral AmericanCentral American IndianCherokeeCheyenneChickasawChileanChineseChippewaChoctawColombianColvilleComancheCosta RicanCreeCreekCroatianCrowCubanCypriotCzechCzechoslovakianDanishDelawareDominicanDutchDutch West IndianEastern EuropeanEcuadorianEgyptianEnglishEstonianEthiopianEuropeanFijianFilipinoFinnishFrenchFrench American IndianFrench CanadianGermanGerman RussianGhanaianGreekGuamanian/ChamorroGuatemalanGuyaneseHaitianHmongHonduranHopiHoumaHungarianIcelanderIndian (Asian)IndonesianInupiatIranianIraqiIrishIroquoisIsraeliItalianJamaicanJapaneseJordanianKenyanKiowaKoreanLaotianLatvianLebaneseLiberianLithuanianLumbeeLuxembourgerMacedonianMalaysianMalteseMarshalleseMenomineeMexicanMexican American IndianMongolianMoroccanNative HawaiianNavajoNepaleseNew ZealanderNicaraguanNigerianNorthern EuropeanNorwegianOkinawanOsageOttawaPaiutePakistaniPalestinianPanamanianParaguayanPennsylvania GermanPeruvianPimaPolishPortuguesePotawatomiPuebloPuerto RicanPuget Sound SalishRomanianRussianSalvadoranSamoanScandinavianScotch-IrishScottishSeminoleSenegaleseSerbianShoshoneSierra LeoneanSiouxSlavicSlovakSloveneSomaliSouth AfricanSouth AmericanSouth American IndianSoviet UnionSpaniardSpanishSpanish AmericanSpanish American IndianSri LankanSubsaharan AfricanSudaneseSwedishSwissSyrianTaiwaneseThaiTlingit-HaidaTohono O'OdhamTonganTrinidadian and TobagonianTsimshianTurkishU.S. Virgin IslanderUgandanUkrainianUruguayanUteVenezuelanVietnameseWelshWest IndianYakamaYaquiYugoslavianYumanYup'ikZimbabwean
Immigration
NonimmigrantsImmigrantsAfghanistanAfricaAlbaniaArgentinaArmeniaAsiaAustraliaAustriaBahamasBangladeshBarbadosBelarusBelgiumBelizeBoliviaBosnia and HerzegovinaBrazilBulgariaBurma/MyanmarCabo VerdeCambodiaCameroonCanadaCaribbeanCentral AmericaChileChinaColombiaCongoCosta RicaCroatiaCubaCzechoslovakiaDenmarkDominicaDominican RepublicEastern AfricaEastern AsiaEastern EuropeEcuadorEgyptEl SalvadorEnglandEritreaEthiopiaEuropeFijiFranceGermanyGhanaGreeceGrenadaGuatemalaGuyanaHaitiHondurasHong KongHungaryIndiaIndonesiaIranIraqIrelandIsraelItalyJamaicaJapanJordanKazakhstanKenyaKoreaKuwaitLaosLatin AmericaLatviaLebanonLiberiaLithuaniaMalaysiaMexicoMicronesiaMiddle AfricaMoldovaMoroccoNepalNetherlandsNicaraguaNigeriaNorth AmericaNorth MacedoniaNorthern AfricaNorthern EuropeNorwayOceaniaPakistanPanamaPeruPhilippinesPolandPortugalRomaniaRussiaSaudi ArabiaScotlandSenegalSerbiaSierra LeoneSingaporeSomaliaSouth AfricaSouth AmericaSouth Central AsiaSouth Eastern AsiaSouthern EuropeSpainSri LankaSt. Vincent and the GrenadinesSudanSwedenSwitzerlandSyriaTaiwanThailandTrinidad and TobagoTurkeyUgandaUkraineUruguayUzbekistanVenezuelaVietnamWest IndiesWestern AfricaWestern AsiaWestern EuropeYemenZaireZimbabweAzores
Celtic
Race
Ancestry
AfghanAfricanAlaska NativeAlaskan AthabascanAlbanianAleutAlsatianAmericanApacheArabArapahoArgentineanArmenianAssyrian/Chaldean/SyriacAustralianAustrianBahamianBangladeshiBarbadianBasqueBelgianBelizeanBermudanBhutaneseBlackfeetBolivianBrazilianBritishBritish West IndianBulgarianBurmeseCajunCambodianCanadianCape VerdeanCarpatho RusynCelticCentral AmericanCentral American IndianCherokeeCheyenneChickasawChileanChineseChippewaChoctawColombianColvilleComancheCosta RicanCreeCreekCroatianCrowCubanCypriotCzechCzechoslovakianDanishDelawareDominicanDutchDutch West IndianEastern EuropeanEcuadorianEgyptianEnglishEstonianEthiopianEuropeanFijianFilipinoFinnishFrenchFrench American IndianFrench CanadianGermanGerman RussianGhanaianGreekGuamanian/ChamorroGuatemalanGuyaneseHaitianHmongHonduranHopiHoumaHungarianIcelanderIndian (Asian)IndonesianInupiatIranianIraqiIrishIroquoisIsraeliItalianJamaicanJapaneseJordanianKenyanKiowaKoreanLaotianLatvianLebaneseLiberianLithuanianLumbeeLuxembourgerMacedonianMalaysianMalteseMarshalleseMenomineeMexicanMexican American IndianMongolianMoroccanNative HawaiianNavajoNepaleseNew ZealanderNicaraguanNigerianNorthern EuropeanNorwegianOkinawanOsageOttawaPaiutePakistaniPalestinianPanamanianParaguayanPennsylvania GermanPeruvianPimaPolishPortuguesePotawatomiPuebloPuerto RicanPuget Sound SalishRomanianRussianSalvadoranSamoanScandinavianScotch-IrishScottishSeminoleSenegaleseSerbianShoshoneSierra LeoneanSiouxSlavicSlovakSloveneSomaliSouth AfricanSouth AmericanSouth American IndianSoviet UnionSpaniardSpanishSpanish AmericanSpanish American IndianSri LankanSubsaharan AfricanSudaneseSwedishSwissSyrianTaiwaneseThaiTlingit-HaidaTohono O'OdhamTonganTrinidadian and TobagonianTsimshianTurkishU.S. Virgin IslanderUgandanUkrainianUruguayanUteVenezuelanVietnameseWelshWest IndianYakamaYaquiYugoslavianYumanYup'ikZimbabwean
Immigration
NonimmigrantsImmigrantsAfghanistanAfricaAlbaniaArgentinaArmeniaAsiaAustraliaAustriaBahamasBangladeshBarbadosBelarusBelgiumBelizeBoliviaBosnia and HerzegovinaBrazilBulgariaBurma/MyanmarCabo VerdeCambodiaCameroonCanadaCaribbeanCentral AmericaChileChinaColombiaCongoCosta RicaCroatiaCubaCzechoslovakiaDenmarkDominicaDominican RepublicEastern AfricaEastern AsiaEastern EuropeEcuadorEgyptEl SalvadorEnglandEritreaEthiopiaEuropeFijiFranceGermanyGhanaGreeceGrenadaGuatemalaGuyanaHaitiHondurasHong KongHungaryIndiaIndonesiaIranIraqIrelandIsraelItalyJamaicaJapanJordanKazakhstanKenyaKoreaKuwaitLaosLatin AmericaLatviaLebanonLiberiaLithuaniaMalaysiaMexicoMicronesiaMiddle AfricaMoldovaMoroccoNepalNetherlandsNicaraguaNigeriaNorth AmericaNorth MacedoniaNorthern AfricaNorthern EuropeNorwayOceaniaPakistanPanamaPeruPhilippinesPolandPortugalRomaniaRussiaSaudi ArabiaScotlandSenegalSerbiaSierra LeoneSingaporeSomaliaSouth AfricaSouth AmericaSouth Central AsiaSouth Eastern AsiaSouthern EuropeSpainSri LankaSt. Vincent and the GrenadinesSudanSwedenSwitzerlandSyriaTaiwanThailandTrinidad and TobagoTurkeyUgandaUkraineUruguayUzbekistanVenezuelaVietnamWest IndiesWestern AfricaWestern AsiaWestern EuropeYemenZaireZimbabweAzores
Married-couple Households
Income
Poverty
Unemployment
Labor Participation
Family Structure
Vehicle Availability
Education Level
Disability

Married-couple Households Comparison

Hispanics or Latinos

Celtics

Tragic
Excellent
45.4%
MARRIED-COUPLE HOUSEHOLDS
8.7/ 100
METRIC RATING
208th/ 347
METRIC RANK
47.3%
MARRIED-COUPLE HOUSEHOLDS
88.1/ 100
METRIC RATING
127th/ 347
METRIC RANK

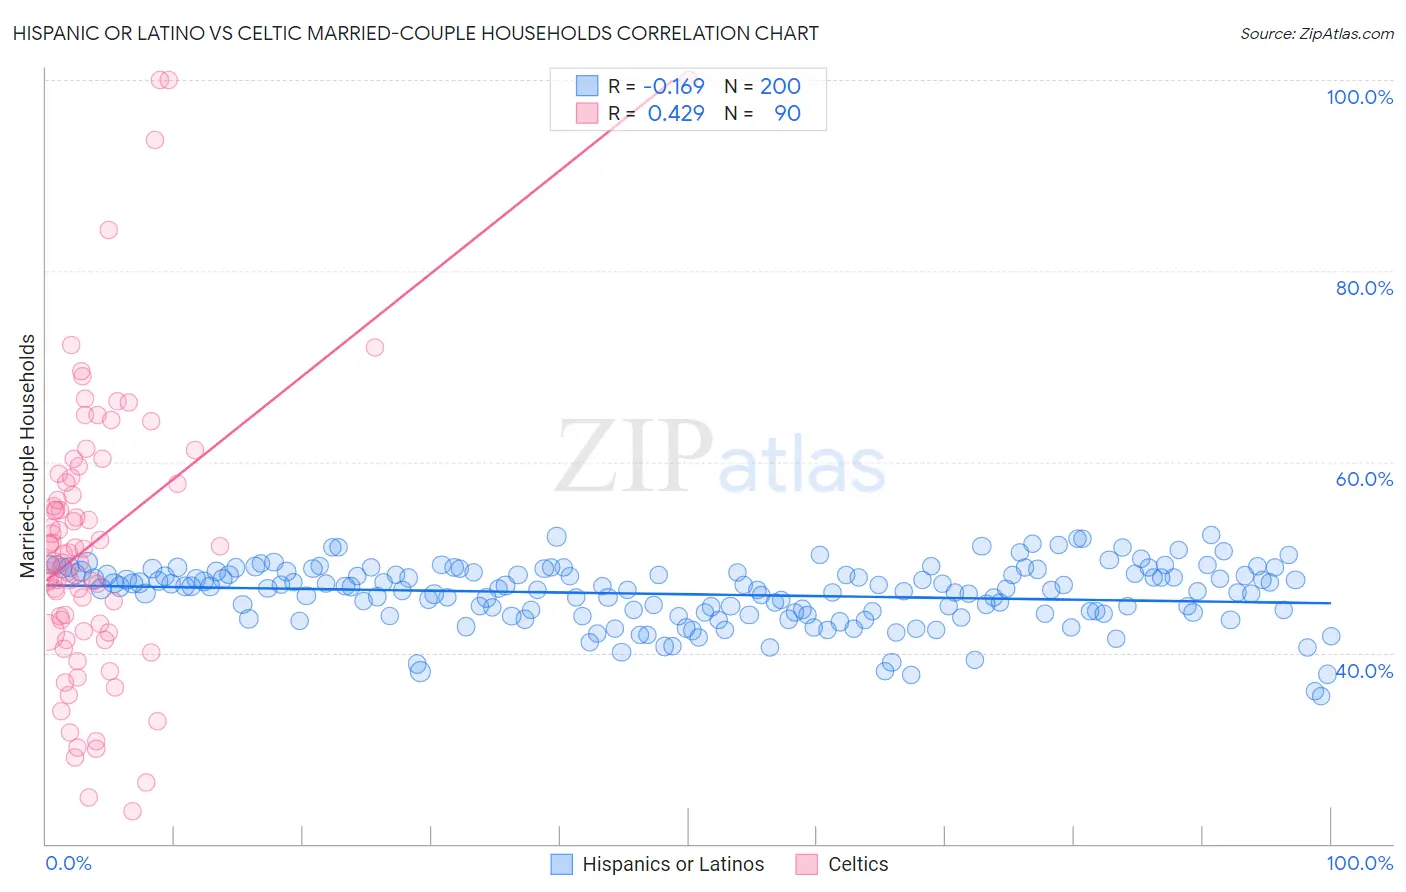
Hispanic or Latino vs Celtic Married-couple Households Correlation Chart

The statistical analysis conducted on geographies consisting of 576,946,669 people shows a poor negative correlation between the proportion of Hispanics or Latinos and percentage of married-couple family households in the United States with a correlation coefficient (R) of -0.169 and weighted average of 45.4%. Similarly, the statistical analysis conducted on geographies consisting of 168,846,519 people shows a moderate positive correlation between the proportion of Celtics and percentage of married-couple family households in the United States with a correlation coefficient (R) of 0.429 and weighted average of 47.3%, a difference of 4.2%.
Hispanic or Latino vs Celtic Married-couple Households

Married-couple Households Correlation Summary

MeasurementHispanic or LatinoCeltic
Minimum35.5%23.4%
Maximum52.3%100.0%
Range16.9%76.6%
Mean46.1%51.8%
Median46.7%50.4%
Interquartile 25% (IQ1)44.2%42.3%
Interquartile 75% (IQ3)48.3%58.3%
Interquartile Range (IQR)4.2%16.1%
Standard Deviation (Sample)3.2%15.3%
Standard Deviation (Population)3.2%15.3%

Similar Demographics by Married-couple Households

Demographics Similar to Hispanics or Latinos by Married-couple Households

In terms of married-couple households, the demographic groups most similar to Hispanics or Latinos are Immigrants from France (45.4%, a difference of 0.010%), Immigrants from Uzbekistan (45.4%, a difference of 0.040%), Cuban (45.4%, a difference of 0.13%), Uruguayan (45.5%, a difference of 0.19%), and Immigrants from Spain (45.3%, a difference of 0.19%).
DemographicsRating | RankMarried-couple Households
Immigrants | Serbia
15.2
/100
|
#201
Poor
45.7%
Immigrants | Central America
14.2
/100
|
#202
Poor
45.7%
Alaska Natives
13.0
/100
|
#203
Poor
45.6%
Aleuts
12.5
/100
|
#204
Poor
45.6%
Nepalese
11.9
/100
|
#205
Poor
45.6%
Uruguayans
10.4
/100
|
#206
Poor
45.5%
Immigrants | France
8.8
/100
|
#207
Tragic
45.4%
Hispanics or Latinos
8.7
/100
|
#208
Tragic
45.4%
Immigrants | Uzbekistan
8.4
/100
|
#209
Tragic
45.4%
Cubans
7.7
/100
|
#210
Tragic
45.4%
Immigrants | Spain
7.3
/100
|
#211
Tragic
45.3%
Creek
6.4
/100
|
#212
Tragic
45.3%
Yakama
5.8
/100
|
#213
Tragic
45.2%
Japanese
5.7
/100
|
#214
Tragic
45.2%
Immigrants | Nepal
5.6
/100
|
#215
Tragic
45.2%

Demographics Similar to Celtics by Married-couple Households

In terms of married-couple households, the demographic groups most similar to Celtics are Immigrants from Peru (47.3%, a difference of 0.020%), Immigrants from Iraq (47.3%, a difference of 0.030%), Immigrants from Hungary (47.3%, a difference of 0.030%), Pakistani (47.3%, a difference of 0.040%), and Immigrants from Denmark (47.3%, a difference of 0.050%).
DemographicsRating | RankMarried-couple Households
Puget Sound Salish
90.5
/100
|
#120
Exceptional
47.4%
Immigrants | Eastern Europe
90.3
/100
|
#121
Exceptional
47.4%
Okinawans
90.1
/100
|
#122
Exceptional
47.4%
Immigrants | Venezuela
89.3
/100
|
#123
Excellent
47.4%
Zimbabweans
89.2
/100
|
#124
Excellent
47.4%
Australians
89.0
/100
|
#125
Excellent
47.4%
Pakistanis
88.6
/100
|
#126
Excellent
47.3%
Celtics
88.1
/100
|
#127
Excellent
47.3%
Immigrants | Peru
87.9
/100
|
#128
Excellent
47.3%
Immigrants | Iraq
87.8
/100
|
#129
Excellent
47.3%
Immigrants | Hungary
87.8
/100
|
#130
Excellent
47.3%
Immigrants | Denmark
87.5
/100
|
#131
Excellent
47.3%
Immigrants | Ukraine
86.7
/100
|
#132
Excellent
47.3%
South Africans
86.4
/100
|
#133
Excellent
47.3%
Immigrants | Greece
86.0
/100
|
#134
Excellent
47.2%