Hispanic or Latino vs American Female Unemployment
COMPARE
Hispanic or Latino
American
Female Unemployment
Female Unemployment Comparison
Hispanics or Latinos
Americans
6.2%
FEMALE UNEMPLOYMENT
0.0/ 100
METRIC RATING
308th/ 347
METRIC RANK
5.1%
FEMALE UNEMPLOYMENT
90.5/ 100
METRIC RATING
116th/ 347
METRIC RANK
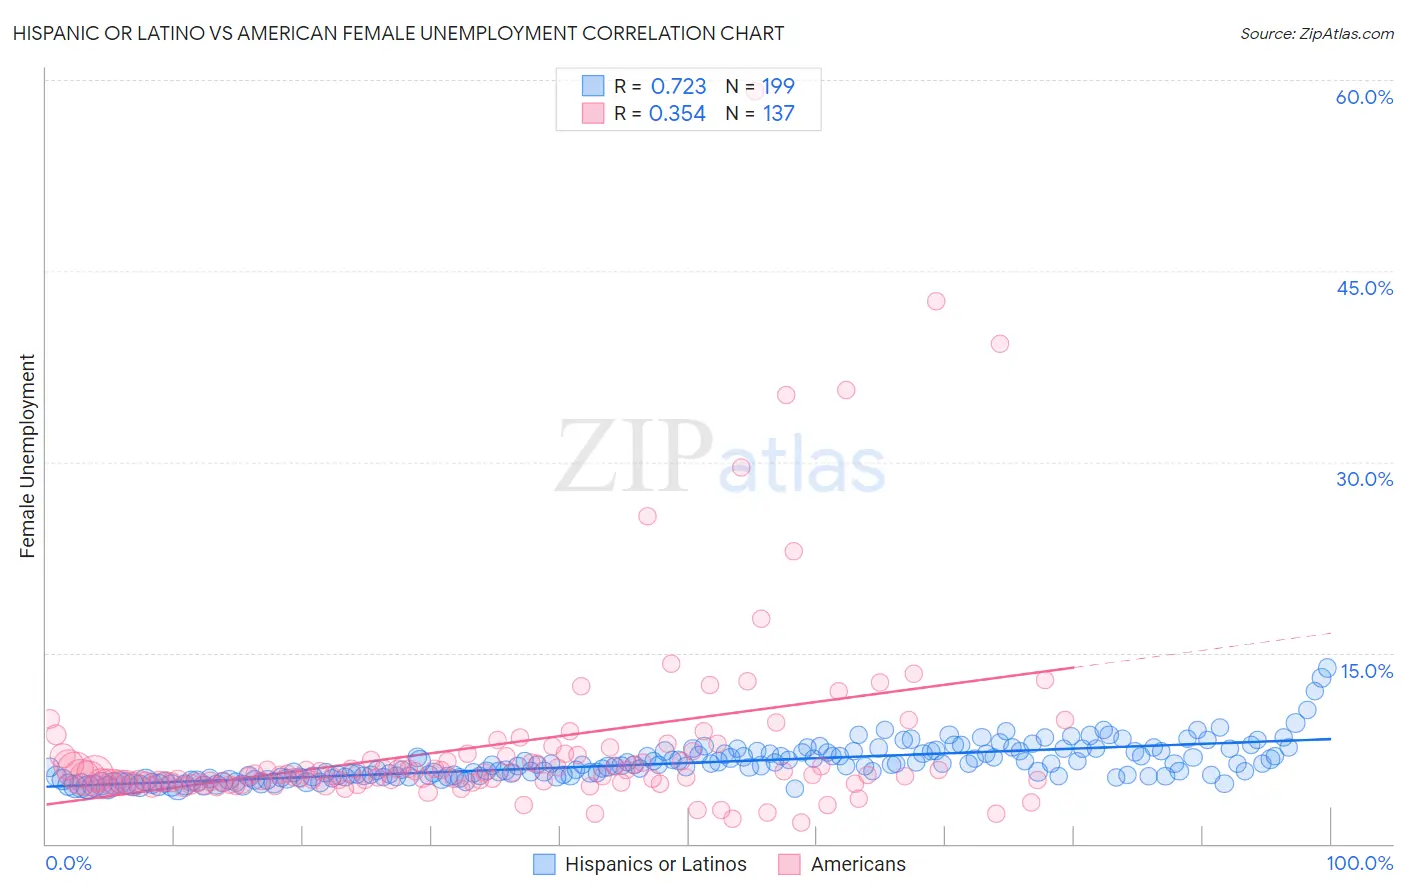
Hispanic or Latino vs American Female Unemployment Correlation Chart
The statistical analysis conducted on geographies consisting of 562,804,515 people shows a strong positive correlation between the proportion of Hispanics or Latinos and unemploymnet rate among females in the United States with a correlation coefficient (R) of 0.723 and weighted average of 6.2%. Similarly, the statistical analysis conducted on geographies consisting of 565,732,279 people shows a mild positive correlation between the proportion of Americans and unemploymnet rate among females in the United States with a correlation coefficient (R) of 0.354 and weighted average of 5.1%, a difference of 22.7%.
Female Unemployment Correlation Summary
| Measurement | Hispanic or Latino | American |
| Minimum | 4.3% | 1.7% |
| Maximum | 13.8% | 59.1% |
| Range | 9.5% | 57.4% |
| Mean | 6.3% | 7.8% |
| Median | 6.1% | 5.4% |
| Interquartile 25% (IQ1) | 5.3% | 4.8% |
| Interquartile 75% (IQ3) | 7.2% | 6.9% |
| Interquartile Range (IQR) | 1.9% | 2.1% |
| Standard Deviation (Sample) | 1.5% | 8.0% |
| Standard Deviation (Population) | 1.5% | 7.9% |
Similar Demographics by Female Unemployment
Demographics Similar to Hispanics or Latinos by Female Unemployment
In terms of female unemployment, the demographic groups most similar to Hispanics or Latinos are Shoshone (6.2%, a difference of 0.060%), Immigrants from Central America (6.2%, a difference of 0.070%), Spanish American Indian (6.2%, a difference of 0.23%), Immigrants from Jamaica (6.2%, a difference of 0.29%), and Ecuadorian (6.3%, a difference of 0.58%).
| Demographics | Rating | Rank | Female Unemployment |
| Immigrants | Barbados | 0.0 /100 | #301 | Tragic 6.2% |
| U.S. Virgin Islanders | 0.0 /100 | #302 | Tragic 6.2% |
| Barbadians | 0.0 /100 | #303 | Tragic 6.2% |
| Immigrants | Jamaica | 0.0 /100 | #304 | Tragic 6.2% |
| Spanish American Indians | 0.0 /100 | #305 | Tragic 6.2% |
| Immigrants | Central America | 0.0 /100 | #306 | Tragic 6.2% |
| Shoshone | 0.0 /100 | #307 | Tragic 6.2% |
| Hispanics or Latinos | 0.0 /100 | #308 | Tragic 6.2% |
| Ecuadorians | 0.0 /100 | #309 | Tragic 6.3% |
| Central American Indians | 0.0 /100 | #310 | Tragic 6.3% |
| Immigrants | Mexico | 0.0 /100 | #311 | Tragic 6.3% |
| Immigrants | Grenada | 0.0 /100 | #312 | Tragic 6.3% |
| Belizeans | 0.0 /100 | #313 | Tragic 6.3% |
| Immigrants | Ecuador | 0.0 /100 | #314 | Tragic 6.4% |
| Pueblo | 0.0 /100 | #315 | Tragic 6.4% |
Demographics Similar to Americans by Female Unemployment
In terms of female unemployment, the demographic groups most similar to Americans are Jordanian (5.1%, a difference of 0.040%), Lebanese (5.1%, a difference of 0.080%), Immigrants from Turkey (5.1%, a difference of 0.10%), Immigrants from Croatia (5.1%, a difference of 0.11%), and Immigrants from Saudi Arabia (5.1%, a difference of 0.13%).
| Demographics | Rating | Rank | Female Unemployment |
| Immigrants | Eastern Africa | 92.8 /100 | #109 | Exceptional 5.1% |
| Macedonians | 92.4 /100 | #110 | Exceptional 5.1% |
| Immigrants | Burma/Myanmar | 92.3 /100 | #111 | Exceptional 5.1% |
| Estonians | 92.1 /100 | #112 | Exceptional 5.1% |
| Immigrants | Saudi Arabia | 91.2 /100 | #113 | Exceptional 5.1% |
| Immigrants | Turkey | 91.0 /100 | #114 | Exceptional 5.1% |
| Lebanese | 91.0 /100 | #115 | Exceptional 5.1% |
| Americans | 90.5 /100 | #116 | Exceptional 5.1% |
| Jordanians | 90.3 /100 | #117 | Exceptional 5.1% |
| Immigrants | Croatia | 89.9 /100 | #118 | Excellent 5.1% |
| Immigrants | North Macedonia | 88.3 /100 | #119 | Excellent 5.1% |
| Immigrants | Romania | 88.1 /100 | #120 | Excellent 5.1% |
| Immigrants | Western Europe | 88.1 /100 | #121 | Excellent 5.1% |
| Immigrants | Germany | 87.6 /100 | #122 | Excellent 5.1% |
| Immigrants | South Africa | 87.6 /100 | #123 | Excellent 5.1% |