Guyanese vs Spanish American Indian Male Unemployment
COMPARE
Guyanese
Spanish American Indian
Male Unemployment
Male Unemployment Comparison
Guyanese
Spanish American Indians
7.1%
MALE UNEMPLOYMENT
0.0/ 100
METRIC RATING
317th/ 347
METRIC RANK
6.2%
MALE UNEMPLOYMENT
0.0/ 100
METRIC RATING
284th/ 347
METRIC RANK
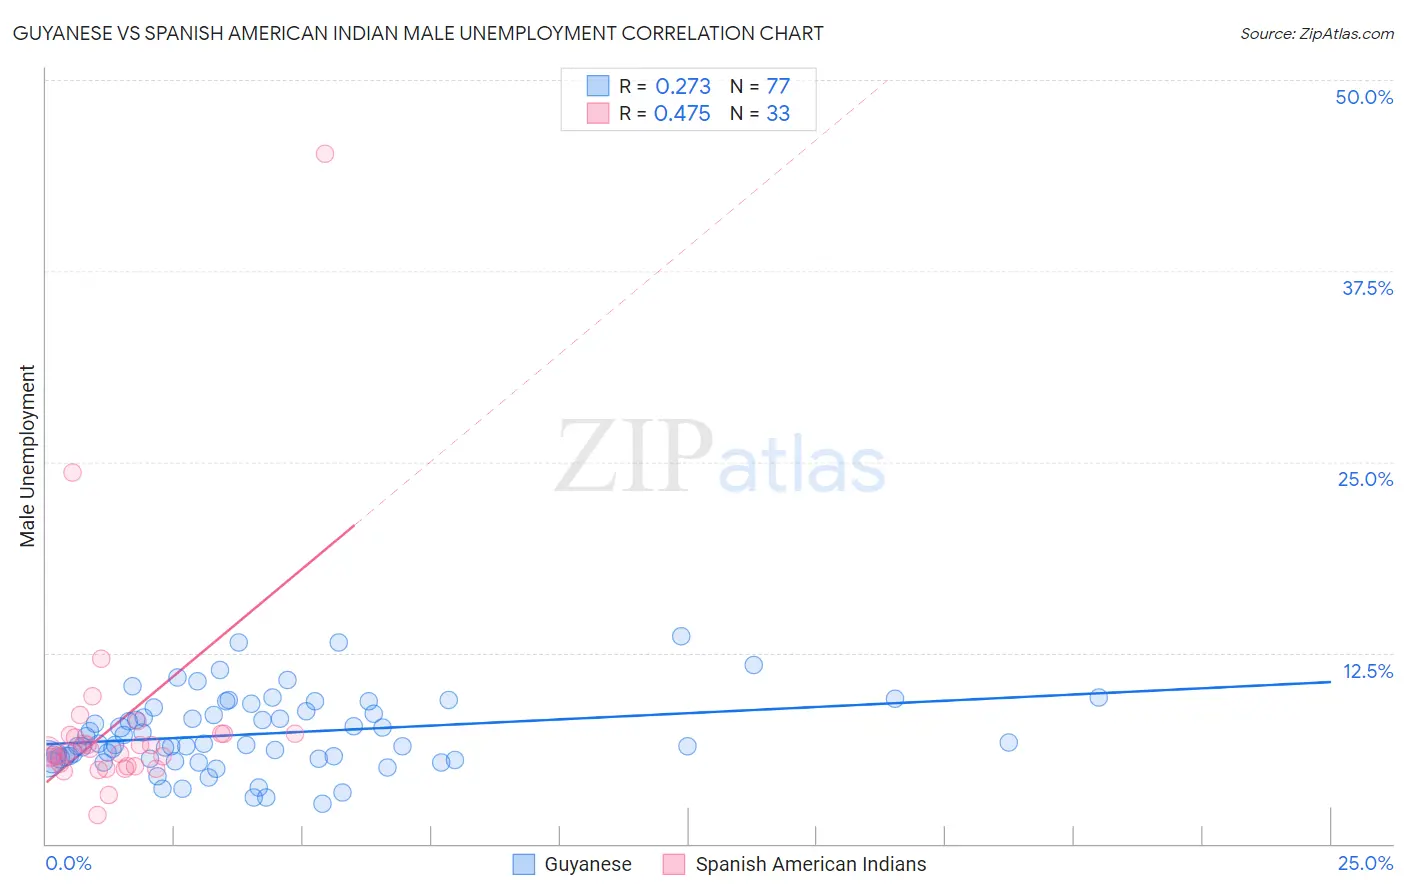
Guyanese vs Spanish American Indian Male Unemployment Correlation Chart
The statistical analysis conducted on geographies consisting of 176,637,764 people shows a weak positive correlation between the proportion of Guyanese and unemployment rate among males in the United States with a correlation coefficient (R) of 0.273 and weighted average of 7.1%. Similarly, the statistical analysis conducted on geographies consisting of 73,090,721 people shows a moderate positive correlation between the proportion of Spanish American Indians and unemployment rate among males in the United States with a correlation coefficient (R) of 0.475 and weighted average of 6.2%, a difference of 14.3%.
Male Unemployment Correlation Summary
| Measurement | Guyanese | Spanish American Indian |
| Minimum | 2.6% | 1.9% |
| Maximum | 13.6% | 45.2% |
| Range | 11.0% | 43.3% |
| Mean | 7.2% | 7.9% |
| Median | 6.5% | 6.0% |
| Interquartile 25% (IQ1) | 5.6% | 5.1% |
| Interquartile 75% (IQ3) | 8.8% | 7.2% |
| Interquartile Range (IQR) | 3.2% | 2.1% |
| Standard Deviation (Sample) | 2.4% | 7.6% |
| Standard Deviation (Population) | 2.4% | 7.5% |
Similar Demographics by Male Unemployment
Demographics Similar to Guyanese by Male Unemployment
In terms of male unemployment, the demographic groups most similar to Guyanese are Immigrants from Guyana (7.1%, a difference of 0.060%), Cape Verdean (7.1%, a difference of 0.070%), Houma (7.1%, a difference of 0.080%), Immigrants from Barbados (7.1%, a difference of 0.30%), and Immigrants from Dominica (7.0%, a difference of 1.6%).
| Demographics | Rating | Rank | Male Unemployment |
| Blacks/African Americans | 0.0 /100 | #310 | Tragic 6.9% |
| Immigrants | Armenia | 0.0 /100 | #311 | Tragic 6.9% |
| Lumbee | 0.0 /100 | #312 | Tragic 6.9% |
| Immigrants | Dominica | 0.0 /100 | #313 | Tragic 7.0% |
| Immigrants | Barbados | 0.0 /100 | #314 | Tragic 7.1% |
| Houma | 0.0 /100 | #315 | Tragic 7.1% |
| Immigrants | Guyana | 0.0 /100 | #316 | Tragic 7.1% |
| Guyanese | 0.0 /100 | #317 | Tragic 7.1% |
| Cape Verdeans | 0.0 /100 | #318 | Tragic 7.1% |
| British West Indians | 0.0 /100 | #319 | Tragic 7.3% |
| Colville | 0.0 /100 | #320 | Tragic 7.4% |
| Immigrants | St. Vincent and the Grenadines | 0.0 /100 | #321 | Tragic 7.5% |
| Immigrants | Cabo Verde | 0.0 /100 | #322 | Tragic 7.5% |
| Immigrants | Grenada | 0.0 /100 | #323 | Tragic 7.6% |
| Dominicans | 0.0 /100 | #324 | Tragic 7.6% |
Demographics Similar to Spanish American Indians by Male Unemployment
In terms of male unemployment, the demographic groups most similar to Spanish American Indians are Immigrants from Ecuador (6.2%, a difference of 0.020%), African (6.3%, a difference of 0.45%), Immigrants from Western Africa (6.2%, a difference of 0.65%), Ecuadorian (6.2%, a difference of 0.68%), and Central American Indian (6.3%, a difference of 0.74%).
| Demographics | Rating | Rank | Male Unemployment |
| Immigrants | Liberia | 0.0 /100 | #277 | Tragic 6.1% |
| Immigrants | Fiji | 0.0 /100 | #278 | Tragic 6.1% |
| Ghanaians | 0.0 /100 | #279 | Tragic 6.1% |
| Immigrants | Ghana | 0.0 /100 | #280 | Tragic 6.2% |
| Sierra Leoneans | 0.0 /100 | #281 | Tragic 6.2% |
| Ecuadorians | 0.0 /100 | #282 | Tragic 6.2% |
| Immigrants | Western Africa | 0.0 /100 | #283 | Tragic 6.2% |
| Spanish American Indians | 0.0 /100 | #284 | Tragic 6.2% |
| Immigrants | Ecuador | 0.0 /100 | #285 | Tragic 6.2% |
| Africans | 0.0 /100 | #286 | Tragic 6.3% |
| Central American Indians | 0.0 /100 | #287 | Tragic 6.3% |
| Immigrants | Senegal | 0.0 /100 | #288 | Tragic 6.3% |
| Immigrants | Caribbean | 0.0 /100 | #289 | Tragic 6.3% |
| U.S. Virgin Islanders | 0.0 /100 | #290 | Tragic 6.4% |
| Immigrants | Azores | 0.0 /100 | #291 | Tragic 6.4% |