Immigrants from Austria vs Immigrants from Peru Unemployment Among Seniors over 75 years
COMPARE
Immigrants from Austria
Immigrants from Peru
Unemployment Among Seniors over 75 years
Unemployment Among Seniors over 75 years Comparison
Immigrants from Austria
Immigrants from Peru
8.0%
UNEMPLOYMENT AMONG SENIORS OVER 75 YEARS
99.9/ 100
METRIC RATING
66th/ 347
METRIC RANK
8.9%
UNEMPLOYMENT AMONG SENIORS OVER 75 YEARS
24.3/ 100
METRIC RATING
201st/ 347
METRIC RANK
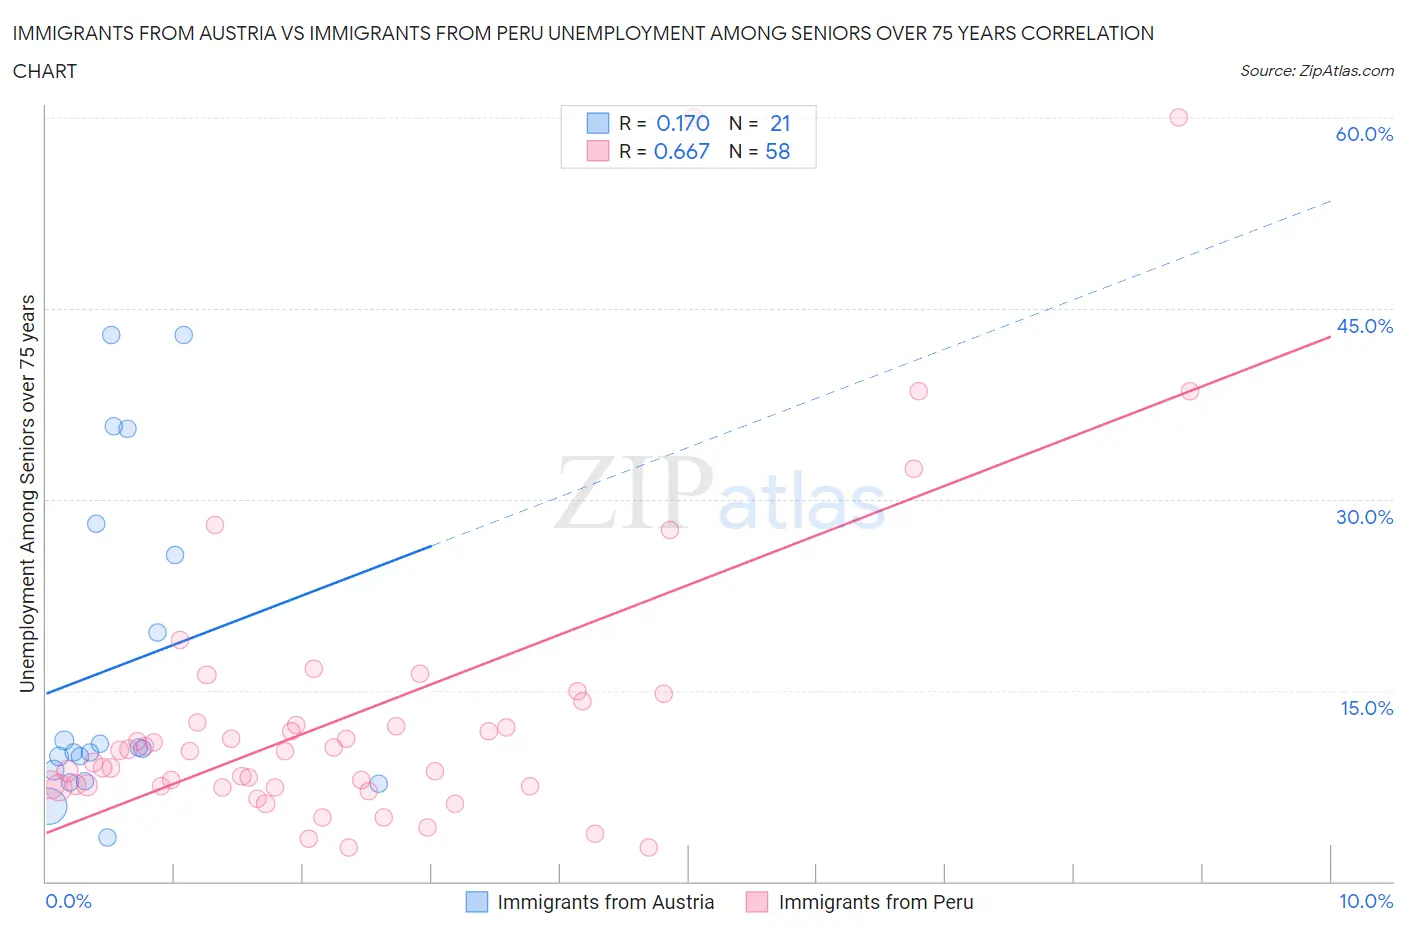
Immigrants from Austria vs Immigrants from Peru Unemployment Among Seniors over 75 years Correlation Chart
The statistical analysis conducted on geographies consisting of 115,770,001 people shows a poor positive correlation between the proportion of Immigrants from Austria and unemployment rate among seniors over the age of 75 in the United States with a correlation coefficient (R) of 0.170 and weighted average of 8.0%. Similarly, the statistical analysis conducted on geographies consisting of 181,477,141 people shows a significant positive correlation between the proportion of Immigrants from Peru and unemployment rate among seniors over the age of 75 in the United States with a correlation coefficient (R) of 0.667 and weighted average of 8.9%, a difference of 11.6%.
Unemployment Among Seniors over 75 years Correlation Summary
| Measurement | Immigrants from Austria | Immigrants from Peru |
| Minimum | 3.4% | 2.7% |
| Maximum | 42.9% | 60.0% |
| Range | 39.5% | 57.3% |
| Mean | 16.9% | 13.2% |
| Median | 10.4% | 10.2% |
| Interquartile 25% (IQ1) | 8.3% | 7.4% |
| Interquartile 75% (IQ3) | 26.9% | 12.5% |
| Interquartile Range (IQR) | 18.6% | 5.0% |
| Standard Deviation (Sample) | 12.7% | 11.7% |
| Standard Deviation (Population) | 12.4% | 11.6% |
Similar Demographics by Unemployment Among Seniors over 75 years
Demographics Similar to Immigrants from Austria by Unemployment Among Seniors over 75 years
In terms of unemployment among seniors over 75 years, the demographic groups most similar to Immigrants from Austria are Immigrants from Syria (8.0%, a difference of 0.040%), Immigrants from South Africa (8.0%, a difference of 0.13%), Indian (Asian) (8.0%, a difference of 0.14%), Argentinean (7.9%, a difference of 0.19%), and Immigrants from Argentina (8.0%, a difference of 0.22%).
| Demographics | Rating | Rank | Unemployment Among Seniors over 75 years |
| Indonesians | 99.9 /100 | #59 | Exceptional 7.9% |
| Immigrants | Morocco | 99.9 /100 | #60 | Exceptional 7.9% |
| Uruguayans | 99.9 /100 | #61 | Exceptional 7.9% |
| Immigrants | Albania | 99.9 /100 | #62 | Exceptional 7.9% |
| Immigrants | Nicaragua | 99.9 /100 | #63 | Exceptional 7.9% |
| Immigrants | Taiwan | 99.9 /100 | #64 | Exceptional 7.9% |
| Argentineans | 99.9 /100 | #65 | Exceptional 7.9% |
| Immigrants | Austria | 99.9 /100 | #66 | Exceptional 8.0% |
| Immigrants | Syria | 99.9 /100 | #67 | Exceptional 8.0% |
| Immigrants | South Africa | 99.9 /100 | #68 | Exceptional 8.0% |
| Indians (Asian) | 99.9 /100 | #69 | Exceptional 8.0% |
| Immigrants | Argentina | 99.9 /100 | #70 | Exceptional 8.0% |
| Immigrants | Cambodia | 99.9 /100 | #71 | Exceptional 8.0% |
| Bolivians | 99.9 /100 | #72 | Exceptional 8.0% |
| Immigrants | France | 99.9 /100 | #73 | Exceptional 8.0% |
Demographics Similar to Immigrants from Peru by Unemployment Among Seniors over 75 years
In terms of unemployment among seniors over 75 years, the demographic groups most similar to Immigrants from Peru are Russian (8.9%, a difference of 0.010%), Immigrants from Northern Europe (8.9%, a difference of 0.030%), Pakistani (8.9%, a difference of 0.080%), Osage (8.9%, a difference of 0.080%), and Eastern European (8.9%, a difference of 0.11%).
| Demographics | Rating | Rank | Unemployment Among Seniors over 75 years |
| Maltese | 29.2 /100 | #194 | Fair 8.8% |
| Okinawans | 28.9 /100 | #195 | Fair 8.8% |
| Immigrants | Jamaica | 27.7 /100 | #196 | Fair 8.9% |
| Immigrants | Laos | 26.3 /100 | #197 | Fair 8.9% |
| Eastern Europeans | 25.9 /100 | #198 | Fair 8.9% |
| Pakistanis | 25.4 /100 | #199 | Fair 8.9% |
| Osage | 25.4 /100 | #200 | Fair 8.9% |
| Immigrants | Peru | 24.3 /100 | #201 | Fair 8.9% |
| Russians | 24.1 /100 | #202 | Fair 8.9% |
| Immigrants | Northern Europe | 23.9 /100 | #203 | Fair 8.9% |
| Spaniards | 22.0 /100 | #204 | Fair 8.9% |
| Koreans | 21.9 /100 | #205 | Fair 8.9% |
| Immigrants | Western Europe | 18.2 /100 | #206 | Poor 8.9% |
| Malaysians | 16.3 /100 | #207 | Poor 8.9% |
| Immigrants | Philippines | 15.8 /100 | #208 | Poor 8.9% |