Guamanian/Chamorro vs Zimbabwean Unemployment Among Seniors over 75 years
COMPARE
Guamanian/Chamorro
Zimbabwean
Unemployment Among Seniors over 75 years
Unemployment Among Seniors over 75 years Comparison
Guamanians/Chamorros
Zimbabweans
9.0%
UNEMPLOYMENT AMONG SENIORS OVER 75 YEARS
7.7/ 100
METRIC RATING
221st/ 347
METRIC RANK
8.7%
UNEMPLOYMENT AMONG SENIORS OVER 75 YEARS
54.1/ 100
METRIC RATING
170th/ 347
METRIC RANK
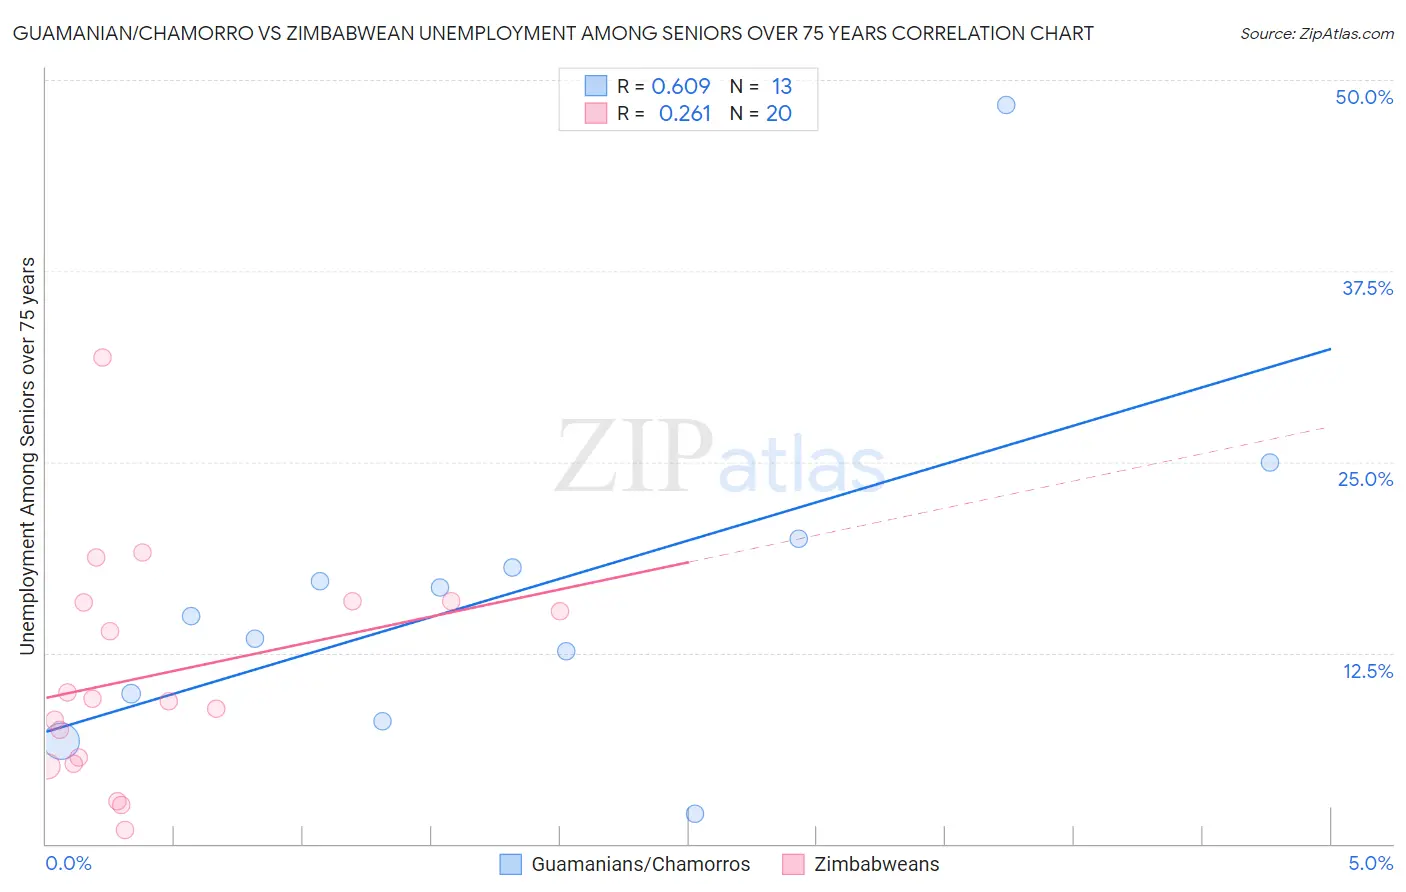
Guamanian/Chamorro vs Zimbabwean Unemployment Among Seniors over 75 years Correlation Chart
The statistical analysis conducted on geographies consisting of 136,667,243 people shows a significant positive correlation between the proportion of Guamanians/Chamorros and unemployment rate among seniors over the age of 75 in the United States with a correlation coefficient (R) of 0.609 and weighted average of 9.0%. Similarly, the statistical analysis conducted on geographies consisting of 56,538,105 people shows a weak positive correlation between the proportion of Zimbabweans and unemployment rate among seniors over the age of 75 in the United States with a correlation coefficient (R) of 0.261 and weighted average of 8.7%, a difference of 3.6%.
Unemployment Among Seniors over 75 years Correlation Summary
| Measurement | Guamanian/Chamorro | Zimbabwean |
| Minimum | 2.0% | 0.90% |
| Maximum | 48.4% | 31.8% |
| Range | 46.4% | 30.9% |
| Mean | 16.4% | 11.1% |
| Median | 14.9% | 9.4% |
| Interquartile 25% (IQ1) | 8.9% | 5.4% |
| Interquartile 75% (IQ3) | 19.0% | 15.8% |
| Interquartile Range (IQR) | 10.1% | 10.4% |
| Standard Deviation (Sample) | 11.4% | 7.4% |
| Standard Deviation (Population) | 10.9% | 7.2% |
Similar Demographics by Unemployment Among Seniors over 75 years
Demographics Similar to Guamanians/Chamorros by Unemployment Among Seniors over 75 years
In terms of unemployment among seniors over 75 years, the demographic groups most similar to Guamanians/Chamorros are Immigrants from Zimbabwe (9.0%, a difference of 0.020%), Peruvian (9.0%, a difference of 0.070%), Afghan (9.0%, a difference of 0.10%), Immigrants from Jordan (9.0%, a difference of 0.14%), and Costa Rican (9.1%, a difference of 0.27%).
| Demographics | Rating | Rank | Unemployment Among Seniors over 75 years |
| Immigrants | Brazil | 13.3 /100 | #214 | Poor 9.0% |
| Immigrants | Western Asia | 12.5 /100 | #215 | Poor 9.0% |
| Immigrants | Oceania | 11.8 /100 | #216 | Poor 9.0% |
| Lebanese | 11.1 /100 | #217 | Poor 9.0% |
| Immigrants | Africa | 9.7 /100 | #218 | Tragic 9.0% |
| Afghans | 8.3 /100 | #219 | Tragic 9.0% |
| Immigrants | Zimbabwe | 7.8 /100 | #220 | Tragic 9.0% |
| Guamanians/Chamorros | 7.7 /100 | #221 | Tragic 9.0% |
| Peruvians | 7.3 /100 | #222 | Tragic 9.0% |
| Immigrants | Jordan | 6.9 /100 | #223 | Tragic 9.0% |
| Costa Ricans | 6.3 /100 | #224 | Tragic 9.1% |
| Navajo | 6.1 /100 | #225 | Tragic 9.1% |
| Immigrants | Bangladesh | 5.9 /100 | #226 | Tragic 9.1% |
| Samoans | 5.7 /100 | #227 | Tragic 9.1% |
| Kenyans | 5.4 /100 | #228 | Tragic 9.1% |
Demographics Similar to Zimbabweans by Unemployment Among Seniors over 75 years
In terms of unemployment among seniors over 75 years, the demographic groups most similar to Zimbabweans are Dominican (8.7%, a difference of 0.12%), Immigrants (8.7%, a difference of 0.12%), Fijian (8.7%, a difference of 0.13%), Immigrants from Lithuania (8.7%, a difference of 0.17%), and Immigrants from Belize (8.7%, a difference of 0.19%).
| Demographics | Rating | Rank | Unemployment Among Seniors over 75 years |
| Immigrants | Guatemala | 68.4 /100 | #163 | Good 8.7% |
| Paraguayans | 62.2 /100 | #164 | Good 8.7% |
| Immigrants | Dominican Republic | 61.4 /100 | #165 | Good 8.7% |
| Immigrants | Belize | 57.6 /100 | #166 | Average 8.7% |
| Immigrants | Eastern Africa | 57.6 /100 | #167 | Average 8.7% |
| Immigrants | Lithuania | 57.2 /100 | #168 | Average 8.7% |
| Fijians | 56.4 /100 | #169 | Average 8.7% |
| Zimbabweans | 54.1 /100 | #170 | Average 8.7% |
| Dominicans | 51.9 /100 | #171 | Average 8.7% |
| Immigrants | Immigrants | 51.8 /100 | #172 | Average 8.7% |
| Australians | 50.3 /100 | #173 | Average 8.7% |
| Immigrants | El Salvador | 49.7 /100 | #174 | Average 8.7% |
| Syrians | 49.6 /100 | #175 | Average 8.7% |
| Somalis | 45.3 /100 | #176 | Average 8.8% |
| Central Americans | 43.3 /100 | #177 | Average 8.8% |