Sudanese vs Immigrants from Western Africa Female Unemployment
COMPARE
Sudanese
Immigrants from Western Africa
Female Unemployment
Female Unemployment Comparison
Sudanese
Immigrants from Western Africa
4.8%
FEMALE UNEMPLOYMENT
99.8/ 100
METRIC RATING
31st/ 347
METRIC RANK
5.9%
FEMALE UNEMPLOYMENT
0.0/ 100
METRIC RATING
269th/ 347
METRIC RANK
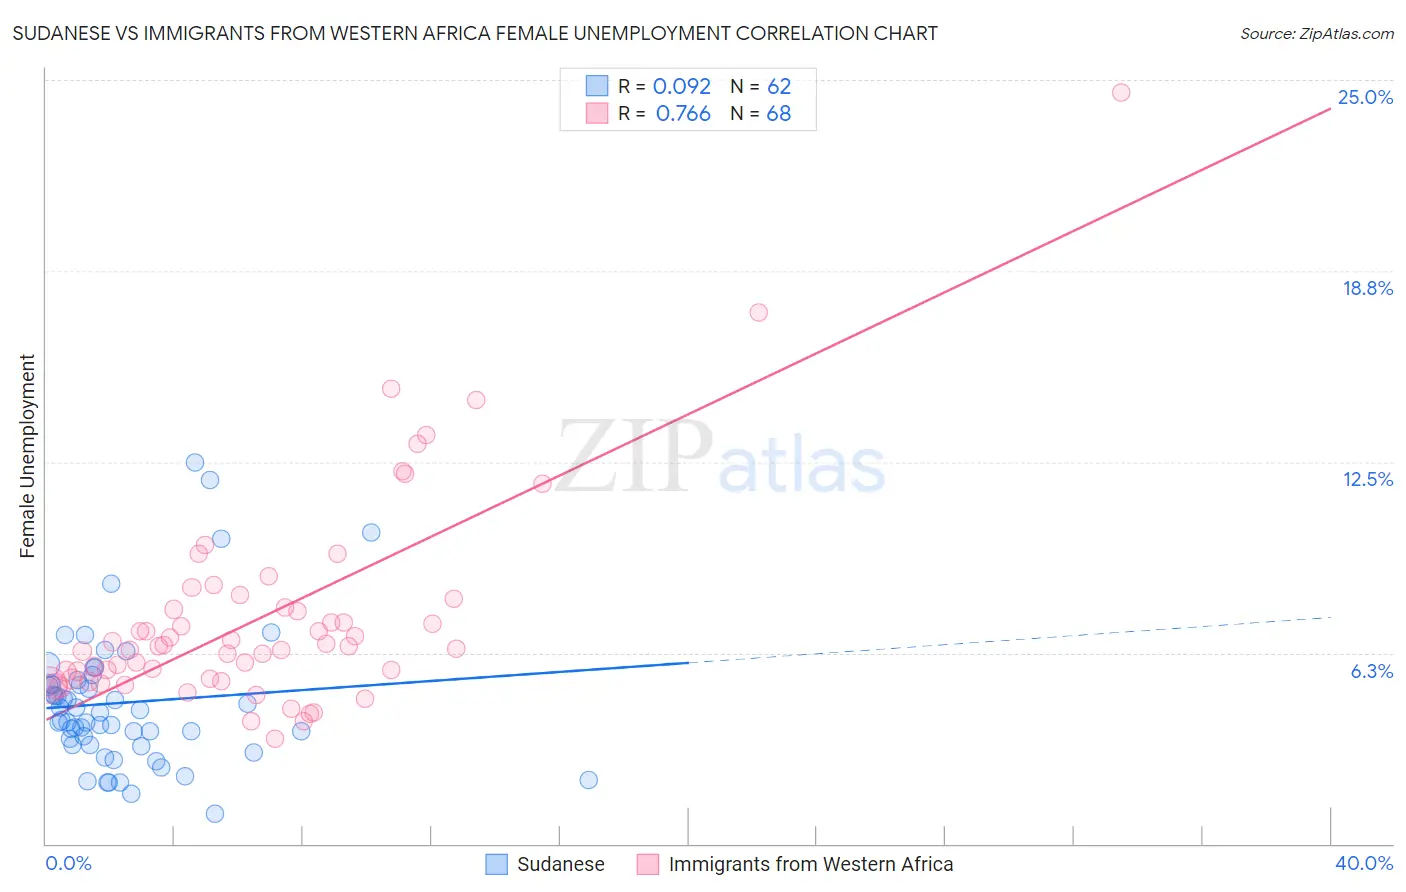
Sudanese vs Immigrants from Western Africa Female Unemployment Correlation Chart
The statistical analysis conducted on geographies consisting of 109,979,396 people shows a slight positive correlation between the proportion of Sudanese and unemploymnet rate among females in the United States with a correlation coefficient (R) of 0.092 and weighted average of 4.8%. Similarly, the statistical analysis conducted on geographies consisting of 356,869,554 people shows a strong positive correlation between the proportion of Immigrants from Western Africa and unemploymnet rate among females in the United States with a correlation coefficient (R) of 0.766 and weighted average of 5.9%, a difference of 24.0%.
Female Unemployment Correlation Summary
| Measurement | Sudanese | Immigrants from Western Africa |
| Minimum | 1.0% | 3.4% |
| Maximum | 12.5% | 24.6% |
| Range | 11.5% | 21.2% |
| Mean | 4.6% | 7.4% |
| Median | 4.2% | 6.5% |
| Interquartile 25% (IQ1) | 3.2% | 5.4% |
| Interquartile 75% (IQ3) | 5.2% | 7.9% |
| Interquartile Range (IQR) | 2.0% | 2.5% |
| Standard Deviation (Sample) | 2.3% | 3.5% |
| Standard Deviation (Population) | 2.3% | 3.5% |
Similar Demographics by Female Unemployment
Demographics Similar to Sudanese by Female Unemployment
In terms of female unemployment, the demographic groups most similar to Sudanese are Slovak (4.8%, a difference of 0.14%), Lithuanian (4.7%, a difference of 0.28%), Cypriot (4.7%, a difference of 0.40%), Irish (4.7%, a difference of 0.41%), and British (4.7%, a difference of 0.44%).
| Demographics | Rating | Rank | Female Unemployment |
| Welsh | 99.9 /100 | #24 | Exceptional 4.7% |
| Immigrants | India | 99.9 /100 | #25 | Exceptional 4.7% |
| Immigrants | Bosnia and Herzegovina | 99.9 /100 | #26 | Exceptional 4.7% |
| British | 99.9 /100 | #27 | Exceptional 4.7% |
| Irish | 99.9 /100 | #28 | Exceptional 4.7% |
| Cypriots | 99.9 /100 | #29 | Exceptional 4.7% |
| Lithuanians | 99.8 /100 | #30 | Exceptional 4.7% |
| Sudanese | 99.8 /100 | #31 | Exceptional 4.8% |
| Slovaks | 99.8 /100 | #32 | Exceptional 4.8% |
| Czechoslovakians | 99.7 /100 | #33 | Exceptional 4.8% |
| Zimbabweans | 99.7 /100 | #34 | Exceptional 4.8% |
| French Canadians | 99.7 /100 | #35 | Exceptional 4.8% |
| Yugoslavians | 99.7 /100 | #36 | Exceptional 4.8% |
| Pennsylvania Germans | 99.6 /100 | #37 | Exceptional 4.8% |
| Northern Europeans | 99.6 /100 | #38 | Exceptional 4.8% |
Demographics Similar to Immigrants from Western Africa by Female Unemployment
In terms of female unemployment, the demographic groups most similar to Immigrants from Western Africa are Honduran (5.9%, a difference of 0.20%), Nepalese (5.9%, a difference of 0.30%), Cape Verdean (5.9%, a difference of 0.40%), Immigrants from Honduras (5.9%, a difference of 0.41%), and Central American (5.9%, a difference of 0.51%).
| Demographics | Rating | Rank | Female Unemployment |
| Immigrants | Nigeria | 0.1 /100 | #262 | Tragic 5.8% |
| Immigrants | Azores | 0.1 /100 | #263 | Tragic 5.8% |
| Immigrants | Bahamas | 0.1 /100 | #264 | Tragic 5.8% |
| Blackfeet | 0.0 /100 | #265 | Tragic 5.9% |
| Cape Verdeans | 0.0 /100 | #266 | Tragic 5.9% |
| Nepalese | 0.0 /100 | #267 | Tragic 5.9% |
| Hondurans | 0.0 /100 | #268 | Tragic 5.9% |
| Immigrants | Western Africa | 0.0 /100 | #269 | Tragic 5.9% |
| Immigrants | Honduras | 0.0 /100 | #270 | Tragic 5.9% |
| Central Americans | 0.0 /100 | #271 | Tragic 5.9% |
| Lumbee | 0.0 /100 | #272 | Tragic 5.9% |
| Ghanaians | 0.0 /100 | #273 | Tragic 5.9% |
| Africans | 0.0 /100 | #274 | Tragic 5.9% |
| Senegalese | 0.0 /100 | #275 | Tragic 6.0% |
| Bahamians | 0.0 /100 | #276 | Tragic 6.0% |