Greek vs Immigrants from Belgium Female Unemployment
COMPARE
Greek
Immigrants from Belgium
Female Unemployment
Female Unemployment Comparison
Greeks
Immigrants from Belgium
4.9%
FEMALE UNEMPLOYMENT
99.4/ 100
METRIC RATING
44th/ 347
METRIC RANK
4.9%
FEMALE UNEMPLOYMENT
98.5/ 100
METRIC RATING
63rd/ 347
METRIC RANK
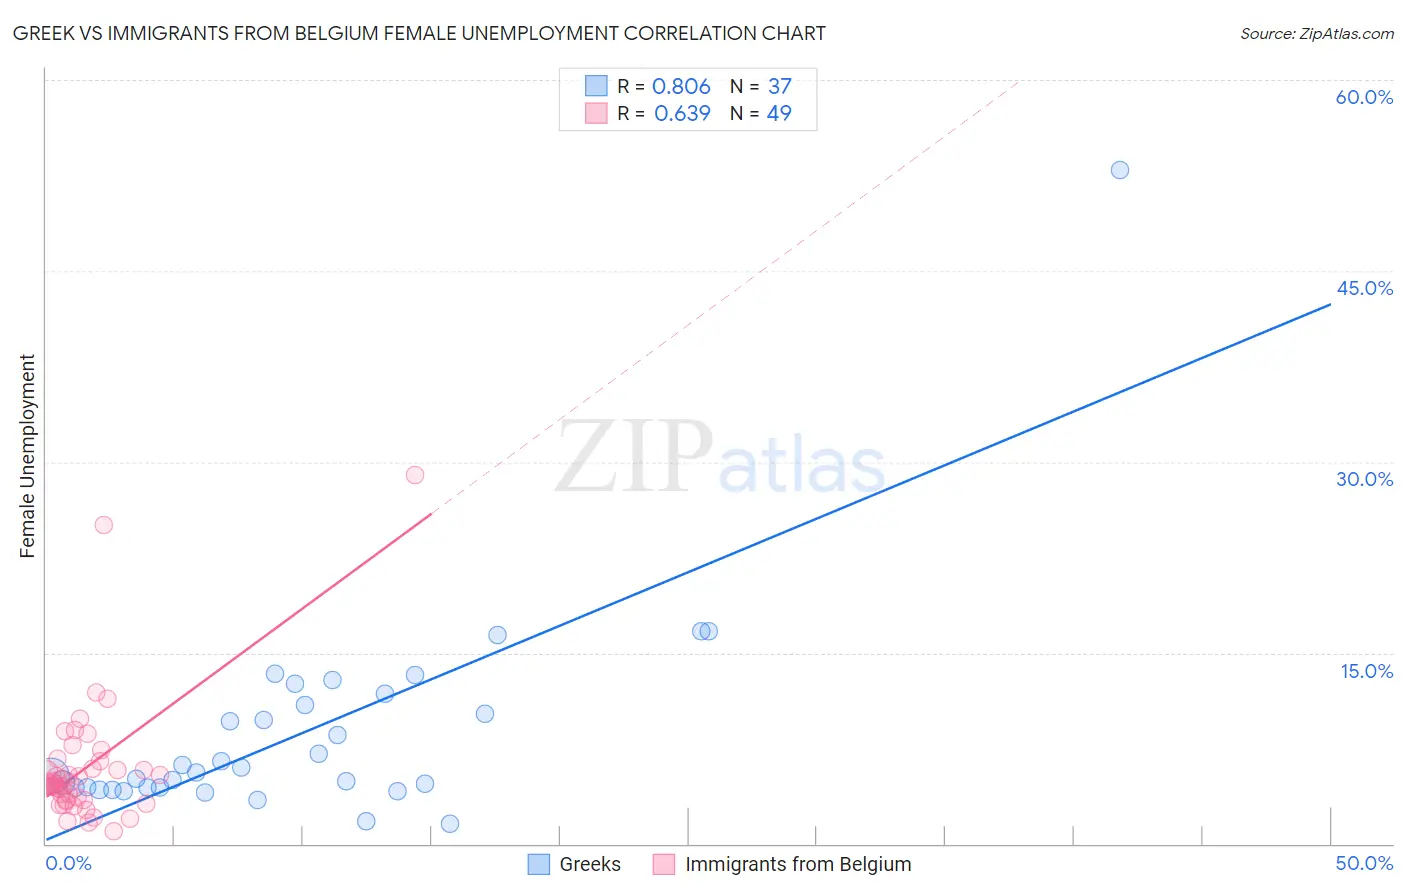
Greek vs Immigrants from Belgium Female Unemployment Correlation Chart
The statistical analysis conducted on geographies consisting of 478,278,385 people shows a very strong positive correlation between the proportion of Greeks and unemploymnet rate among females in the United States with a correlation coefficient (R) of 0.806 and weighted average of 4.9%. Similarly, the statistical analysis conducted on geographies consisting of 146,408,368 people shows a significant positive correlation between the proportion of Immigrants from Belgium and unemploymnet rate among females in the United States with a correlation coefficient (R) of 0.639 and weighted average of 4.9%, a difference of 1.4%.
Female Unemployment Correlation Summary
| Measurement | Greek | Immigrants from Belgium |
| Minimum | 1.6% | 1.0% |
| Maximum | 52.9% | 29.0% |
| Range | 51.3% | 28.0% |
| Mean | 8.7% | 5.9% |
| Median | 5.6% | 4.7% |
| Interquartile 25% (IQ1) | 4.4% | 3.4% |
| Interquartile 75% (IQ3) | 11.4% | 6.2% |
| Interquartile Range (IQR) | 7.0% | 2.8% |
| Standard Deviation (Sample) | 8.6% | 5.0% |
| Standard Deviation (Population) | 8.5% | 4.9% |
Demographics Similar to Greeks and Immigrants from Belgium by Female Unemployment
In terms of female unemployment, the demographic groups most similar to Greeks are Austrian (4.9%, a difference of 0.080%), Immigrants from Bulgaria (4.9%, a difference of 0.10%), Eastern European (4.9%, a difference of 0.11%), Okinawan (4.9%, a difference of 0.19%), and Thai (4.9%, a difference of 0.39%). Similarly, the demographic groups most similar to Immigrants from Belgium are Immigrants from Nepal (4.9%, a difference of 0.11%), Immigrants from Scotland (4.9%, a difference of 0.12%), Immigrants from Canada (4.9%, a difference of 0.12%), Bhutanese (4.9%, a difference of 0.20%), and Immigrants from Lithuania (4.9%, a difference of 0.32%).
| Demographics | Rating | Rank | Female Unemployment |
| Eastern Europeans | 99.4 /100 | #43 | Exceptional 4.9% |
| Greeks | 99.4 /100 | #44 | Exceptional 4.9% |
| Austrians | 99.3 /100 | #45 | Exceptional 4.9% |
| Immigrants | Bulgaria | 99.3 /100 | #46 | Exceptional 4.9% |
| Okinawans | 99.3 /100 | #47 | Exceptional 4.9% |
| Thais | 99.2 /100 | #48 | Exceptional 4.9% |
| Australians | 99.2 /100 | #49 | Exceptional 4.9% |
| Immigrants | Cuba | 99.1 /100 | #50 | Exceptional 4.9% |
| Cambodians | 99.1 /100 | #51 | Exceptional 4.9% |
| Slavs | 99.1 /100 | #52 | Exceptional 4.9% |
| Whites/Caucasians | 99.0 /100 | #53 | Exceptional 4.9% |
| Immigrants | Zimbabwe | 99.0 /100 | #54 | Exceptional 4.9% |
| Immigrants | Moldova | 99.0 /100 | #55 | Exceptional 4.9% |
| Serbians | 99.0 /100 | #56 | Exceptional 4.9% |
| Icelanders | 98.8 /100 | #57 | Exceptional 4.9% |
| Immigrants | Lithuania | 98.8 /100 | #58 | Exceptional 4.9% |
| Bhutanese | 98.7 /100 | #59 | Exceptional 4.9% |
| Immigrants | Scotland | 98.6 /100 | #60 | Exceptional 4.9% |
| Immigrants | Canada | 98.6 /100 | #61 | Exceptional 4.9% |
| Immigrants | Nepal | 98.6 /100 | #62 | Exceptional 4.9% |
| Immigrants | Belgium | 98.5 /100 | #63 | Exceptional 4.9% |