Subsaharan African vs Immigrants from Western Africa Female Unemployment
COMPARE
Subsaharan African
Immigrants from Western Africa
Female Unemployment
Female Unemployment Comparison
Sub-Saharan Africans
Immigrants from Western Africa
5.7%
FEMALE UNEMPLOYMENT
0.4/ 100
METRIC RATING
256th/ 347
METRIC RANK
5.9%
FEMALE UNEMPLOYMENT
0.0/ 100
METRIC RATING
269th/ 347
METRIC RANK
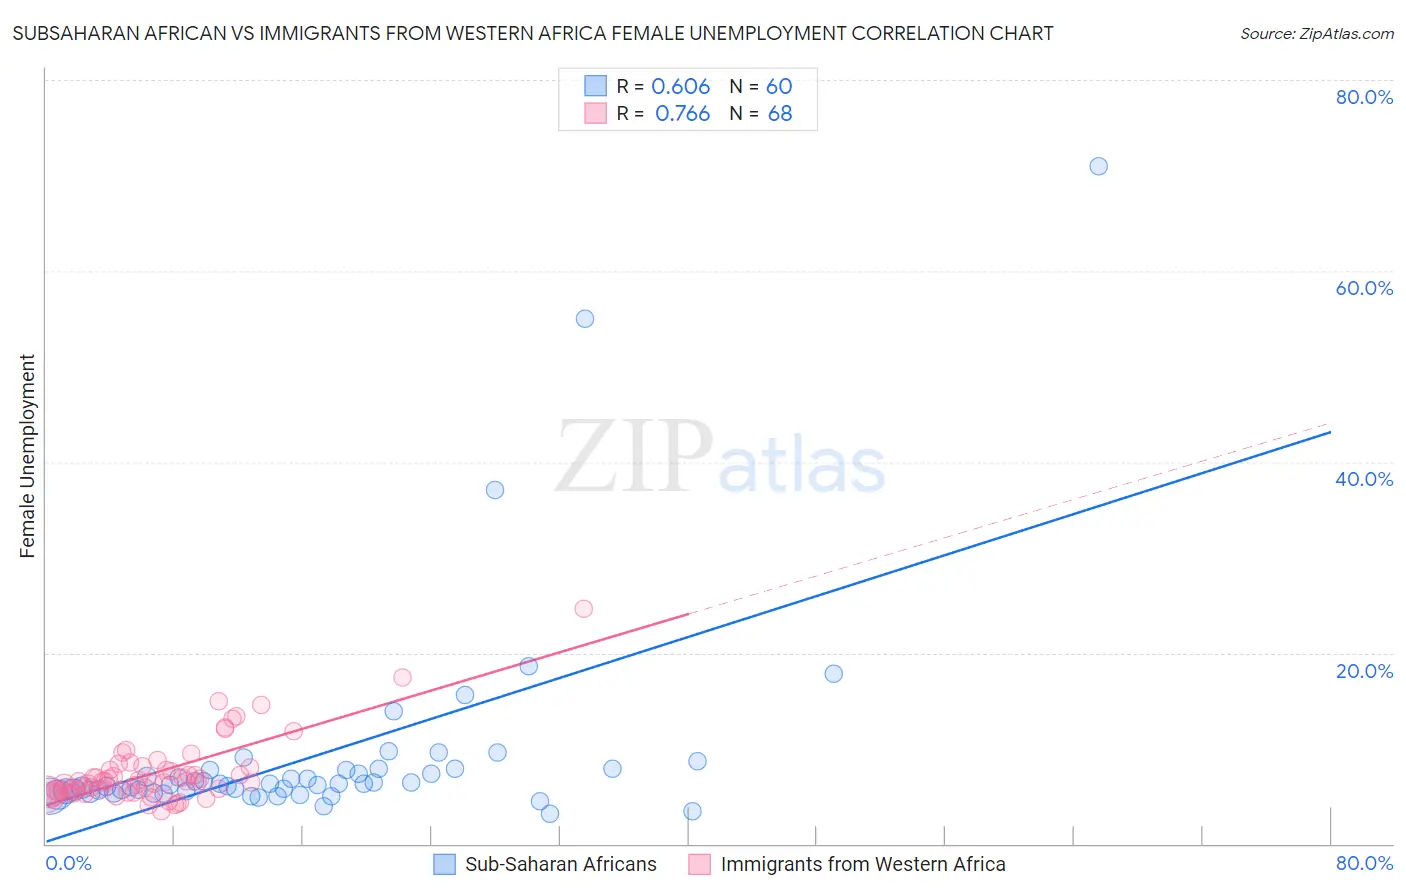
Subsaharan African vs Immigrants from Western Africa Female Unemployment Correlation Chart
The statistical analysis conducted on geographies consisting of 503,774,253 people shows a significant positive correlation between the proportion of Sub-Saharan Africans and unemploymnet rate among females in the United States with a correlation coefficient (R) of 0.606 and weighted average of 5.7%. Similarly, the statistical analysis conducted on geographies consisting of 356,869,554 people shows a strong positive correlation between the proportion of Immigrants from Western Africa and unemploymnet rate among females in the United States with a correlation coefficient (R) of 0.766 and weighted average of 5.9%, a difference of 3.5%.
Female Unemployment Correlation Summary
| Measurement | Subsaharan African | Immigrants from Western Africa |
| Minimum | 3.1% | 3.4% |
| Maximum | 71.0% | 24.6% |
| Range | 67.9% | 21.2% |
| Mean | 9.3% | 7.4% |
| Median | 6.2% | 6.5% |
| Interquartile 25% (IQ1) | 5.5% | 5.4% |
| Interquartile 75% (IQ3) | 7.8% | 7.9% |
| Interquartile Range (IQR) | 2.3% | 2.5% |
| Standard Deviation (Sample) | 11.3% | 3.5% |
| Standard Deviation (Population) | 11.2% | 3.5% |
Demographics Similar to Sub-Saharan Africans and Immigrants from Western Africa by Female Unemployment
In terms of female unemployment, the demographic groups most similar to Sub-Saharan Africans are Dutch West Indian (5.7%, a difference of 0.070%), Immigrants from Cameroon (5.7%, a difference of 0.67%), Immigrants from Sierra Leone (5.7%, a difference of 0.71%), Immigrants (5.7%, a difference of 0.71%), and Cajun (5.7%, a difference of 0.85%). Similarly, the demographic groups most similar to Immigrants from Western Africa are Honduran (5.9%, a difference of 0.20%), Nepalese (5.9%, a difference of 0.30%), Cape Verdean (5.9%, a difference of 0.40%), Immigrants from Honduras (5.9%, a difference of 0.41%), and Central American (5.9%, a difference of 0.51%).
| Demographics | Rating | Rank | Female Unemployment |
| Cajuns | 0.7 /100 | #252 | Tragic 5.7% |
| Immigrants | Sierra Leone | 0.6 /100 | #253 | Tragic 5.7% |
| Immigrants | Immigrants | 0.6 /100 | #254 | Tragic 5.7% |
| Immigrants | Cameroon | 0.6 /100 | #255 | Tragic 5.7% |
| Sub-Saharan Africans | 0.4 /100 | #256 | Tragic 5.7% |
| Dutch West Indians | 0.3 /100 | #257 | Tragic 5.7% |
| Immigrants | Portugal | 0.2 /100 | #258 | Tragic 5.8% |
| Immigrants | Fiji | 0.2 /100 | #259 | Tragic 5.8% |
| Nigerians | 0.2 /100 | #260 | Tragic 5.8% |
| Kiowa | 0.1 /100 | #261 | Tragic 5.8% |
| Immigrants | Nigeria | 0.1 /100 | #262 | Tragic 5.8% |
| Immigrants | Azores | 0.1 /100 | #263 | Tragic 5.8% |
| Immigrants | Bahamas | 0.1 /100 | #264 | Tragic 5.8% |
| Blackfeet | 0.0 /100 | #265 | Tragic 5.9% |
| Cape Verdeans | 0.0 /100 | #266 | Tragic 5.9% |
| Nepalese | 0.0 /100 | #267 | Tragic 5.9% |
| Hondurans | 0.0 /100 | #268 | Tragic 5.9% |
| Immigrants | Western Africa | 0.0 /100 | #269 | Tragic 5.9% |
| Immigrants | Honduras | 0.0 /100 | #270 | Tragic 5.9% |
| Central Americans | 0.0 /100 | #271 | Tragic 5.9% |
| Lumbee | 0.0 /100 | #272 | Tragic 5.9% |