Greek vs Nicaraguan Female Unemployment
COMPARE
Greek
Nicaraguan
Female Unemployment
Female Unemployment Comparison
Greeks
Nicaraguans
4.9%
FEMALE UNEMPLOYMENT
99.4/ 100
METRIC RATING
44th/ 347
METRIC RANK
5.5%
FEMALE UNEMPLOYMENT
7.2/ 100
METRIC RATING
222nd/ 347
METRIC RANK
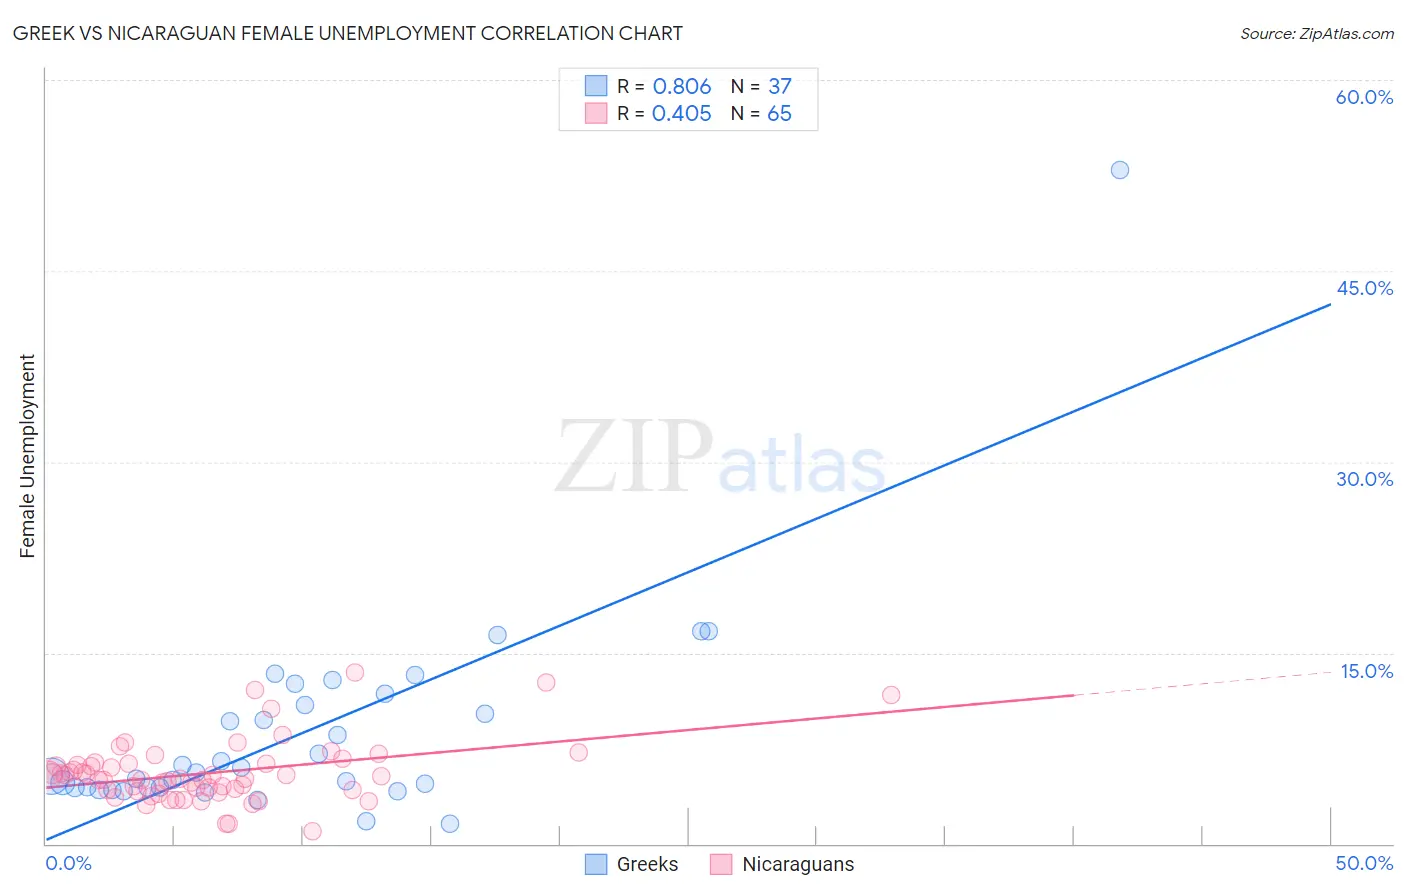
Greek vs Nicaraguan Female Unemployment Correlation Chart
The statistical analysis conducted on geographies consisting of 478,278,385 people shows a very strong positive correlation between the proportion of Greeks and unemploymnet rate among females in the United States with a correlation coefficient (R) of 0.806 and weighted average of 4.9%. Similarly, the statistical analysis conducted on geographies consisting of 285,135,127 people shows a moderate positive correlation between the proportion of Nicaraguans and unemploymnet rate among females in the United States with a correlation coefficient (R) of 0.405 and weighted average of 5.5%, a difference of 12.4%.
Female Unemployment Correlation Summary
| Measurement | Greek | Nicaraguan |
| Minimum | 1.6% | 1.0% |
| Maximum | 52.9% | 13.5% |
| Range | 51.3% | 12.5% |
| Mean | 8.7% | 5.6% |
| Median | 5.6% | 5.1% |
| Interquartile 25% (IQ1) | 4.4% | 4.2% |
| Interquartile 75% (IQ3) | 11.4% | 6.3% |
| Interquartile Range (IQR) | 7.0% | 2.1% |
| Standard Deviation (Sample) | 8.6% | 2.4% |
| Standard Deviation (Population) | 8.5% | 2.4% |
Similar Demographics by Female Unemployment
Demographics Similar to Greeks by Female Unemployment
In terms of female unemployment, the demographic groups most similar to Greeks are Austrian (4.9%, a difference of 0.080%), Immigrants from Bulgaria (4.9%, a difference of 0.10%), Eastern European (4.9%, a difference of 0.11%), Okinawan (4.9%, a difference of 0.19%), and Italian (4.8%, a difference of 0.28%).
| Demographics | Rating | Rank | Female Unemployment |
| Pennsylvania Germans | 99.6 /100 | #37 | Exceptional 4.8% |
| Northern Europeans | 99.6 /100 | #38 | Exceptional 4.8% |
| Scotch-Irish | 99.6 /100 | #39 | Exceptional 4.8% |
| French | 99.6 /100 | #40 | Exceptional 4.8% |
| Tongans | 99.5 /100 | #41 | Exceptional 4.8% |
| Italians | 99.5 /100 | #42 | Exceptional 4.8% |
| Eastern Europeans | 99.4 /100 | #43 | Exceptional 4.9% |
| Greeks | 99.4 /100 | #44 | Exceptional 4.9% |
| Austrians | 99.3 /100 | #45 | Exceptional 4.9% |
| Immigrants | Bulgaria | 99.3 /100 | #46 | Exceptional 4.9% |
| Okinawans | 99.3 /100 | #47 | Exceptional 4.9% |
| Thais | 99.2 /100 | #48 | Exceptional 4.9% |
| Australians | 99.2 /100 | #49 | Exceptional 4.9% |
| Immigrants | Cuba | 99.1 /100 | #50 | Exceptional 4.9% |
| Cambodians | 99.1 /100 | #51 | Exceptional 4.9% |
Demographics Similar to Nicaraguans by Female Unemployment
In terms of female unemployment, the demographic groups most similar to Nicaraguans are Delaware (5.5%, a difference of 0.010%), Brazilian (5.5%, a difference of 0.020%), Iraqi (5.5%, a difference of 0.040%), Immigrants from Africa (5.4%, a difference of 0.26%), and South American (5.4%, a difference of 0.27%).
| Demographics | Rating | Rank | Female Unemployment |
| Immigrants | Nicaragua | 10.2 /100 | #215 | Poor 5.4% |
| Comanche | 10.0 /100 | #216 | Poor 5.4% |
| Peruvians | 9.6 /100 | #217 | Tragic 5.4% |
| Bermudans | 9.0 /100 | #218 | Tragic 5.4% |
| South Americans | 8.6 /100 | #219 | Tragic 5.4% |
| Immigrants | Africa | 8.5 /100 | #220 | Tragic 5.4% |
| Brazilians | 7.3 /100 | #221 | Tragic 5.5% |
| Nicaraguans | 7.2 /100 | #222 | Tragic 5.5% |
| Delaware | 7.2 /100 | #223 | Tragic 5.5% |
| Iraqis | 7.1 /100 | #224 | Tragic 5.5% |
| French American Indians | 6.1 /100 | #225 | Tragic 5.5% |
| Immigrants | Peru | 5.9 /100 | #226 | Tragic 5.5% |
| Immigrants | Philippines | 5.3 /100 | #227 | Tragic 5.5% |
| Israelis | 4.8 /100 | #228 | Tragic 5.5% |
| Panamanians | 4.7 /100 | #229 | Tragic 5.5% |