Greek vs Immigrants from Eritrea Female Unemployment
COMPARE
Greek
Immigrants from Eritrea
Female Unemployment
Female Unemployment Comparison
Greeks
Immigrants from Eritrea
4.9%
FEMALE UNEMPLOYMENT
99.4/ 100
METRIC RATING
44th/ 347
METRIC RANK
5.1%
FEMALE UNEMPLOYMENT
84.6/ 100
METRIC RATING
134th/ 347
METRIC RANK
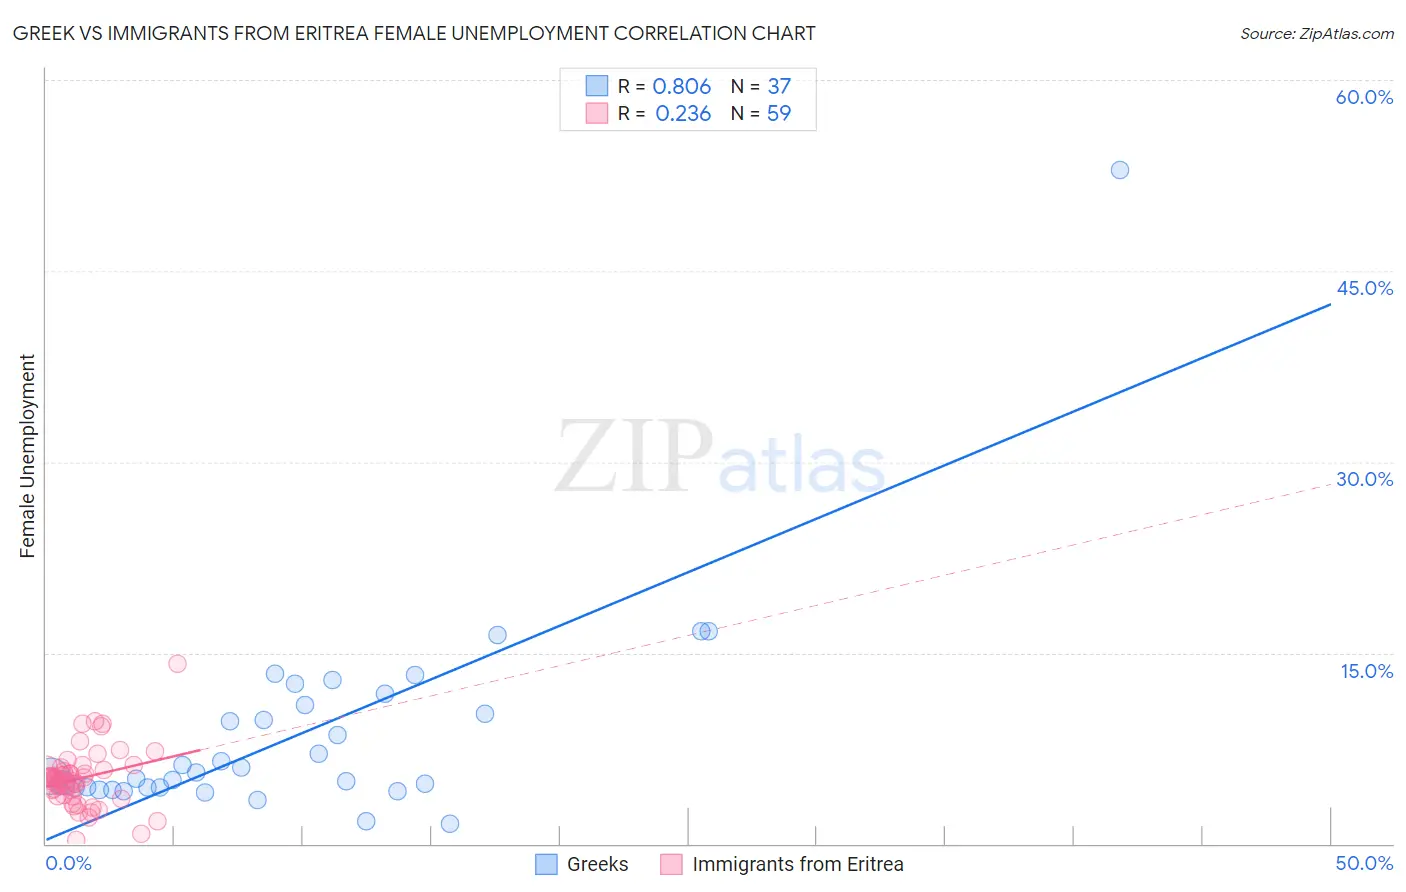
Greek vs Immigrants from Eritrea Female Unemployment Correlation Chart
The statistical analysis conducted on geographies consisting of 478,278,385 people shows a very strong positive correlation between the proportion of Greeks and unemploymnet rate among females in the United States with a correlation coefficient (R) of 0.806 and weighted average of 4.9%. Similarly, the statistical analysis conducted on geographies consisting of 104,834,311 people shows a weak positive correlation between the proportion of Immigrants from Eritrea and unemploymnet rate among females in the United States with a correlation coefficient (R) of 0.236 and weighted average of 5.1%, a difference of 5.5%.
Female Unemployment Correlation Summary
| Measurement | Greek | Immigrants from Eritrea |
| Minimum | 1.6% | 0.30% |
| Maximum | 52.9% | 14.1% |
| Range | 51.3% | 13.8% |
| Mean | 8.7% | 5.1% |
| Median | 5.6% | 5.1% |
| Interquartile 25% (IQ1) | 4.4% | 3.8% |
| Interquartile 75% (IQ3) | 11.4% | 5.8% |
| Interquartile Range (IQR) | 7.0% | 2.0% |
| Standard Deviation (Sample) | 8.6% | 2.3% |
| Standard Deviation (Population) | 8.5% | 2.2% |
Similar Demographics by Female Unemployment
Demographics Similar to Greeks by Female Unemployment
In terms of female unemployment, the demographic groups most similar to Greeks are Austrian (4.9%, a difference of 0.080%), Immigrants from Bulgaria (4.9%, a difference of 0.10%), Eastern European (4.9%, a difference of 0.11%), Okinawan (4.9%, a difference of 0.19%), and Italian (4.8%, a difference of 0.28%).
| Demographics | Rating | Rank | Female Unemployment |
| Pennsylvania Germans | 99.6 /100 | #37 | Exceptional 4.8% |
| Northern Europeans | 99.6 /100 | #38 | Exceptional 4.8% |
| Scotch-Irish | 99.6 /100 | #39 | Exceptional 4.8% |
| French | 99.6 /100 | #40 | Exceptional 4.8% |
| Tongans | 99.5 /100 | #41 | Exceptional 4.8% |
| Italians | 99.5 /100 | #42 | Exceptional 4.8% |
| Eastern Europeans | 99.4 /100 | #43 | Exceptional 4.9% |
| Greeks | 99.4 /100 | #44 | Exceptional 4.9% |
| Austrians | 99.3 /100 | #45 | Exceptional 4.9% |
| Immigrants | Bulgaria | 99.3 /100 | #46 | Exceptional 4.9% |
| Okinawans | 99.3 /100 | #47 | Exceptional 4.9% |
| Thais | 99.2 /100 | #48 | Exceptional 4.9% |
| Australians | 99.2 /100 | #49 | Exceptional 4.9% |
| Immigrants | Cuba | 99.1 /100 | #50 | Exceptional 4.9% |
| Cambodians | 99.1 /100 | #51 | Exceptional 4.9% |
Demographics Similar to Immigrants from Eritrea by Female Unemployment
In terms of female unemployment, the demographic groups most similar to Immigrants from Eritrea are Immigrants from Latvia (5.1%, a difference of 0.0%), Immigrants from Hong Kong (5.1%, a difference of 0.020%), Immigrants from Sri Lanka (5.1%, a difference of 0.040%), Indian (Asian) (5.1%, a difference of 0.050%), and Immigrants from Ethiopia (5.1%, a difference of 0.090%).
| Demographics | Rating | Rank | Female Unemployment |
| Immigrants | Hungary | 86.0 /100 | #127 | Excellent 5.1% |
| Chileans | 85.8 /100 | #128 | Excellent 5.1% |
| Ethiopians | 85.7 /100 | #129 | Excellent 5.1% |
| Maltese | 85.5 /100 | #130 | Excellent 5.1% |
| Immigrants | Ethiopia | 85.4 /100 | #131 | Excellent 5.1% |
| Immigrants | Sri Lanka | 85.0 /100 | #132 | Excellent 5.1% |
| Immigrants | Hong Kong | 84.8 /100 | #133 | Excellent 5.1% |
| Immigrants | Eritrea | 84.6 /100 | #134 | Excellent 5.1% |
| Immigrants | Latvia | 84.6 /100 | #135 | Excellent 5.1% |
| Indians (Asian) | 84.2 /100 | #136 | Excellent 5.1% |
| Pakistanis | 83.8 /100 | #137 | Excellent 5.1% |
| Chickasaw | 83.2 /100 | #138 | Excellent 5.1% |
| Immigrants | Eastern Asia | 83.0 /100 | #139 | Excellent 5.1% |
| Immigrants | France | 82.7 /100 | #140 | Excellent 5.1% |
| Immigrants | Eastern Europe | 81.5 /100 | #141 | Excellent 5.1% |