German Russian vs Immigrants from Southern Europe Male Unemployment
COMPARE
German Russian
Immigrants from Southern Europe
Male Unemployment
Male Unemployment Comparison
German Russians
Immigrants from Southern Europe
5.1%
MALE UNEMPLOYMENT
92.7/ 100
METRIC RATING
101st/ 347
METRIC RANK
5.4%
MALE UNEMPLOYMENT
17.7/ 100
METRIC RATING
195th/ 347
METRIC RANK
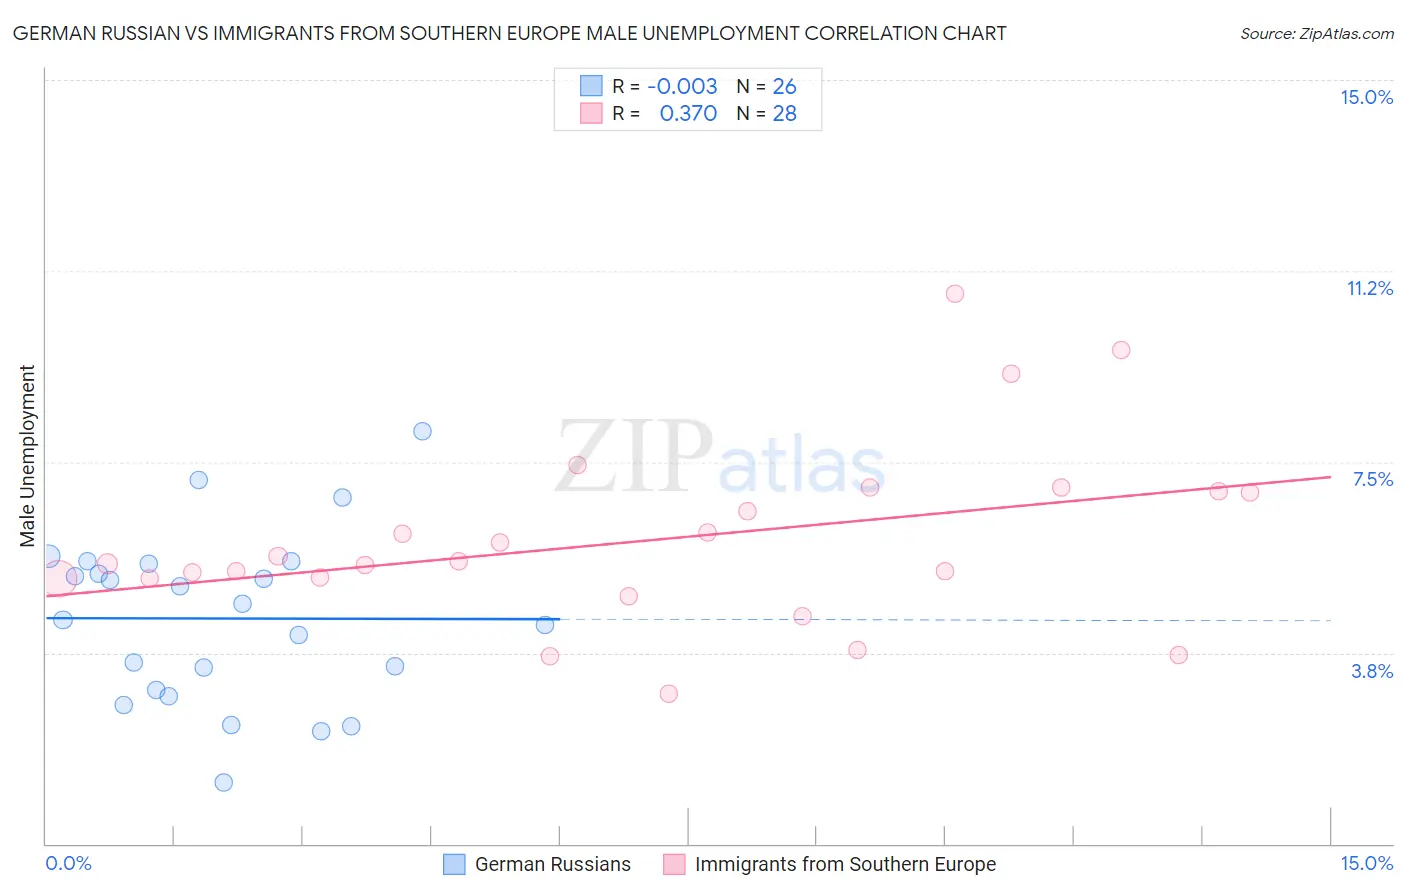
German Russian vs Immigrants from Southern Europe Male Unemployment Correlation Chart
The statistical analysis conducted on geographies consisting of 96,273,571 people shows no correlation between the proportion of German Russians and unemployment rate among males in the United States with a correlation coefficient (R) of -0.003 and weighted average of 5.1%. Similarly, the statistical analysis conducted on geographies consisting of 401,185,353 people shows a mild positive correlation between the proportion of Immigrants from Southern Europe and unemployment rate among males in the United States with a correlation coefficient (R) of 0.370 and weighted average of 5.4%, a difference of 6.2%.
Male Unemployment Correlation Summary
| Measurement | German Russian | Immigrants from Southern Europe |
| Minimum | 1.2% | 2.9% |
| Maximum | 8.1% | 10.8% |
| Range | 6.9% | 7.9% |
| Mean | 4.4% | 6.0% |
| Median | 4.6% | 5.5% |
| Interquartile 25% (IQ1) | 3.0% | 5.2% |
| Interquartile 75% (IQ3) | 5.5% | 6.9% |
| Interquartile Range (IQR) | 2.5% | 1.7% |
| Standard Deviation (Sample) | 1.7% | 1.8% |
| Standard Deviation (Population) | 1.6% | 1.7% |
Similar Demographics by Male Unemployment
Demographics Similar to German Russians by Male Unemployment
In terms of male unemployment, the demographic groups most similar to German Russians are Immigrants from France (5.1%, a difference of 0.020%), Russian (5.1%, a difference of 0.040%), Uruguayan (5.1%, a difference of 0.060%), Immigrants from Kuwait (5.1%, a difference of 0.12%), and Immigrants from Spain (5.1%, a difference of 0.16%).
| Demographics | Rating | Rank | Male Unemployment |
| Canadians | 94.1 /100 | #94 | Exceptional 5.1% |
| Italians | 93.8 /100 | #95 | Exceptional 5.1% |
| Asians | 93.7 /100 | #96 | Exceptional 5.1% |
| Immigrants | Spain | 93.4 /100 | #97 | Exceptional 5.1% |
| Immigrants | Kuwait | 93.3 /100 | #98 | Exceptional 5.1% |
| Uruguayans | 93.0 /100 | #99 | Exceptional 5.1% |
| Russians | 92.9 /100 | #100 | Exceptional 5.1% |
| German Russians | 92.7 /100 | #101 | Exceptional 5.1% |
| Immigrants | France | 92.7 /100 | #102 | Exceptional 5.1% |
| Immigrants | Jordan | 91.9 /100 | #103 | Exceptional 5.1% |
| Immigrants | Chile | 91.8 /100 | #104 | Exceptional 5.1% |
| Immigrants | Czechoslovakia | 91.7 /100 | #105 | Exceptional 5.1% |
| Immigrants | Ethiopia | 91.5 /100 | #106 | Exceptional 5.1% |
| Ethiopians | 91.3 /100 | #107 | Exceptional 5.1% |
| Immigrants | Nicaragua | 91.2 /100 | #108 | Exceptional 5.1% |
Demographics Similar to Immigrants from Southern Europe by Male Unemployment
In terms of male unemployment, the demographic groups most similar to Immigrants from Southern Europe are Albanian (5.4%, a difference of 0.040%), Alsatian (5.4%, a difference of 0.10%), Spanish (5.4%, a difference of 0.18%), Immigrants from Thailand (5.4%, a difference of 0.32%), and Immigrants from Greece (5.4%, a difference of 0.34%).
| Demographics | Rating | Rank | Male Unemployment |
| Arabs | 30.2 /100 | #188 | Fair 5.4% |
| Immigrants | South America | 29.4 /100 | #189 | Fair 5.4% |
| Immigrants | Uganda | 28.8 /100 | #190 | Fair 5.4% |
| Immigrants | South Eastern Asia | 28.2 /100 | #191 | Fair 5.4% |
| Immigrants | Belarus | 26.0 /100 | #192 | Fair 5.4% |
| Immigrants | Israel | 25.2 /100 | #193 | Fair 5.4% |
| Spanish | 19.7 /100 | #194 | Poor 5.4% |
| Immigrants | Southern Europe | 17.7 /100 | #195 | Poor 5.4% |
| Albanians | 17.3 /100 | #196 | Poor 5.4% |
| Alsatians | 16.7 /100 | #197 | Poor 5.4% |
| Immigrants | Thailand | 14.7 /100 | #198 | Poor 5.4% |
| Immigrants | Greece | 14.5 /100 | #199 | Poor 5.4% |
| Immigrants | Zaire | 13.7 /100 | #200 | Poor 5.4% |
| Immigrants | Philippines | 13.5 /100 | #201 | Poor 5.4% |
| Immigrants | Nonimmigrants | 13.1 /100 | #202 | Poor 5.4% |