German Russian vs Immigrants from Nicaragua Male Unemployment
COMPARE
German Russian
Immigrants from Nicaragua
Male Unemployment
Male Unemployment Comparison
German Russians
Immigrants from Nicaragua
5.1%
MALE UNEMPLOYMENT
92.7/ 100
METRIC RATING
101st/ 347
METRIC RANK
5.1%
MALE UNEMPLOYMENT
91.2/ 100
METRIC RATING
108th/ 347
METRIC RANK
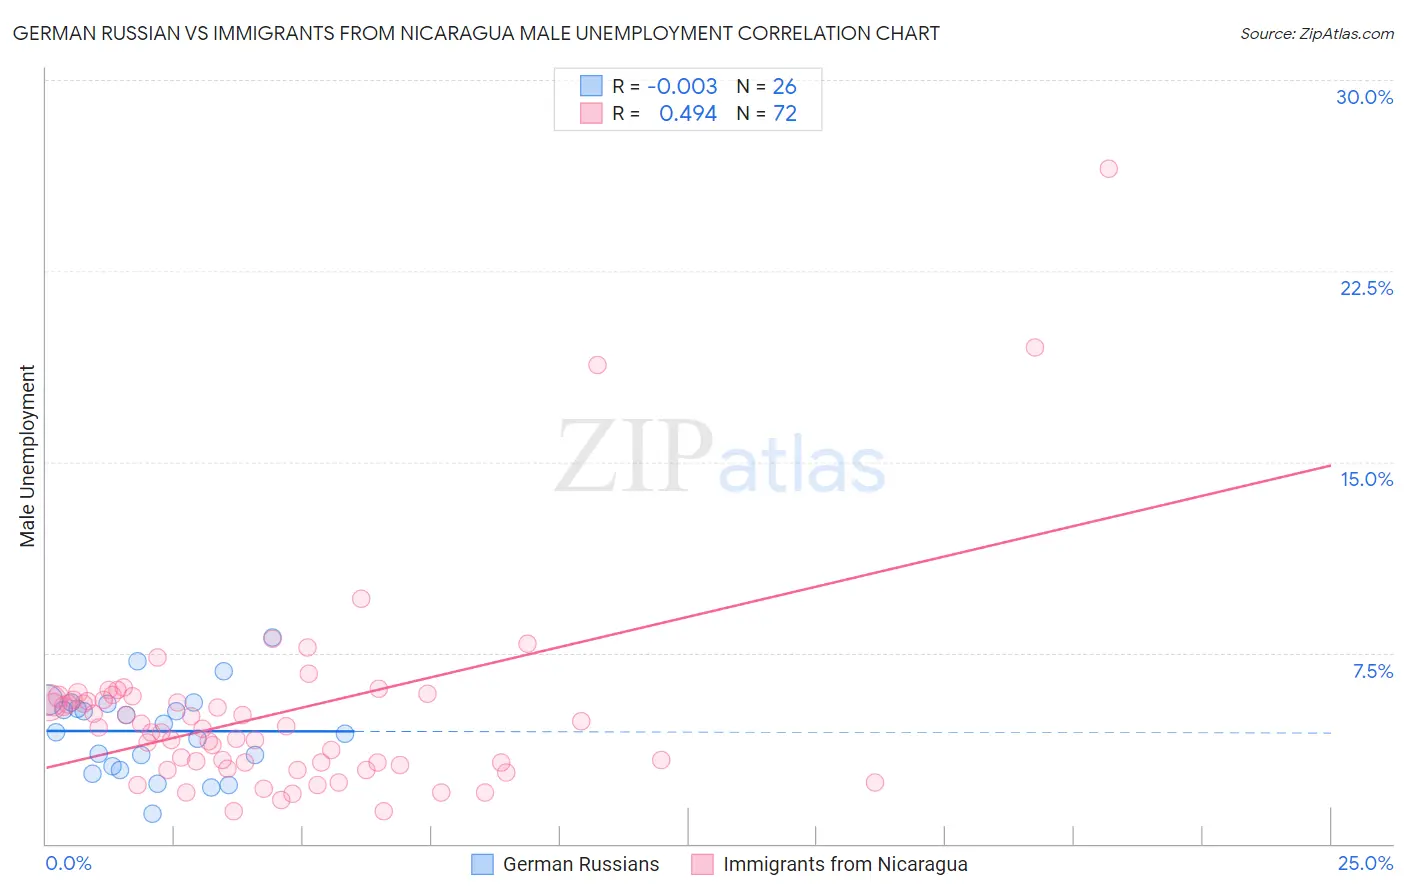
German Russian vs Immigrants from Nicaragua Male Unemployment Correlation Chart
The statistical analysis conducted on geographies consisting of 96,273,571 people shows no correlation between the proportion of German Russians and unemployment rate among males in the United States with a correlation coefficient (R) of -0.003 and weighted average of 5.1%. Similarly, the statistical analysis conducted on geographies consisting of 236,032,179 people shows a moderate positive correlation between the proportion of Immigrants from Nicaragua and unemployment rate among males in the United States with a correlation coefficient (R) of 0.494 and weighted average of 5.1%, a difference of 0.31%.
Male Unemployment Correlation Summary
| Measurement | German Russian | Immigrants from Nicaragua |
| Minimum | 1.2% | 1.3% |
| Maximum | 8.1% | 26.5% |
| Range | 6.9% | 25.2% |
| Mean | 4.4% | 5.1% |
| Median | 4.6% | 4.5% |
| Interquartile 25% (IQ1) | 3.0% | 3.2% |
| Interquartile 75% (IQ3) | 5.5% | 5.7% |
| Interquartile Range (IQR) | 2.5% | 2.6% |
| Standard Deviation (Sample) | 1.7% | 3.9% |
| Standard Deviation (Population) | 1.6% | 3.9% |
Demographics Similar to German Russians and Immigrants from Nicaragua by Male Unemployment
In terms of male unemployment, the demographic groups most similar to German Russians are Immigrants from France (5.1%, a difference of 0.020%), Russian (5.1%, a difference of 0.040%), Uruguayan (5.1%, a difference of 0.060%), Immigrants from Kuwait (5.1%, a difference of 0.12%), and Immigrants from Spain (5.1%, a difference of 0.16%). Similarly, the demographic groups most similar to Immigrants from Nicaragua are Ethiopian (5.1%, a difference of 0.010%), Immigrants from Ethiopia (5.1%, a difference of 0.050%), Immigrants from Pakistan (5.1%, a difference of 0.060%), Immigrants from England (5.1%, a difference of 0.080%), and Immigrants from Czechoslovakia (5.1%, a difference of 0.090%).
| Demographics | Rating | Rank | Male Unemployment |
| Canadians | 94.1 /100 | #94 | Exceptional 5.1% |
| Italians | 93.8 /100 | #95 | Exceptional 5.1% |
| Asians | 93.7 /100 | #96 | Exceptional 5.1% |
| Immigrants | Spain | 93.4 /100 | #97 | Exceptional 5.1% |
| Immigrants | Kuwait | 93.3 /100 | #98 | Exceptional 5.1% |
| Uruguayans | 93.0 /100 | #99 | Exceptional 5.1% |
| Russians | 92.9 /100 | #100 | Exceptional 5.1% |
| German Russians | 92.7 /100 | #101 | Exceptional 5.1% |
| Immigrants | France | 92.7 /100 | #102 | Exceptional 5.1% |
| Immigrants | Jordan | 91.9 /100 | #103 | Exceptional 5.1% |
| Immigrants | Chile | 91.8 /100 | #104 | Exceptional 5.1% |
| Immigrants | Czechoslovakia | 91.7 /100 | #105 | Exceptional 5.1% |
| Immigrants | Ethiopia | 91.5 /100 | #106 | Exceptional 5.1% |
| Ethiopians | 91.3 /100 | #107 | Exceptional 5.1% |
| Immigrants | Nicaragua | 91.2 /100 | #108 | Exceptional 5.1% |
| Immigrants | Pakistan | 90.9 /100 | #109 | Exceptional 5.1% |
| Immigrants | England | 90.8 /100 | #110 | Exceptional 5.1% |
| Immigrants | Eastern Asia | 90.8 /100 | #111 | Exceptional 5.1% |
| Immigrants | Moldova | 90.3 /100 | #112 | Exceptional 5.1% |
| Immigrants | Austria | 90.3 /100 | #113 | Exceptional 5.1% |
| Romanians | 89.8 /100 | #114 | Excellent 5.1% |