German Russian vs Palestinian Male Unemployment
COMPARE
German Russian
Palestinian
Male Unemployment
Male Unemployment Comparison
German Russians
Palestinians
5.1%
MALE UNEMPLOYMENT
92.7/ 100
METRIC RATING
101st/ 347
METRIC RANK
5.1%
MALE UNEMPLOYMENT
87.7/ 100
METRIC RATING
123rd/ 347
METRIC RANK
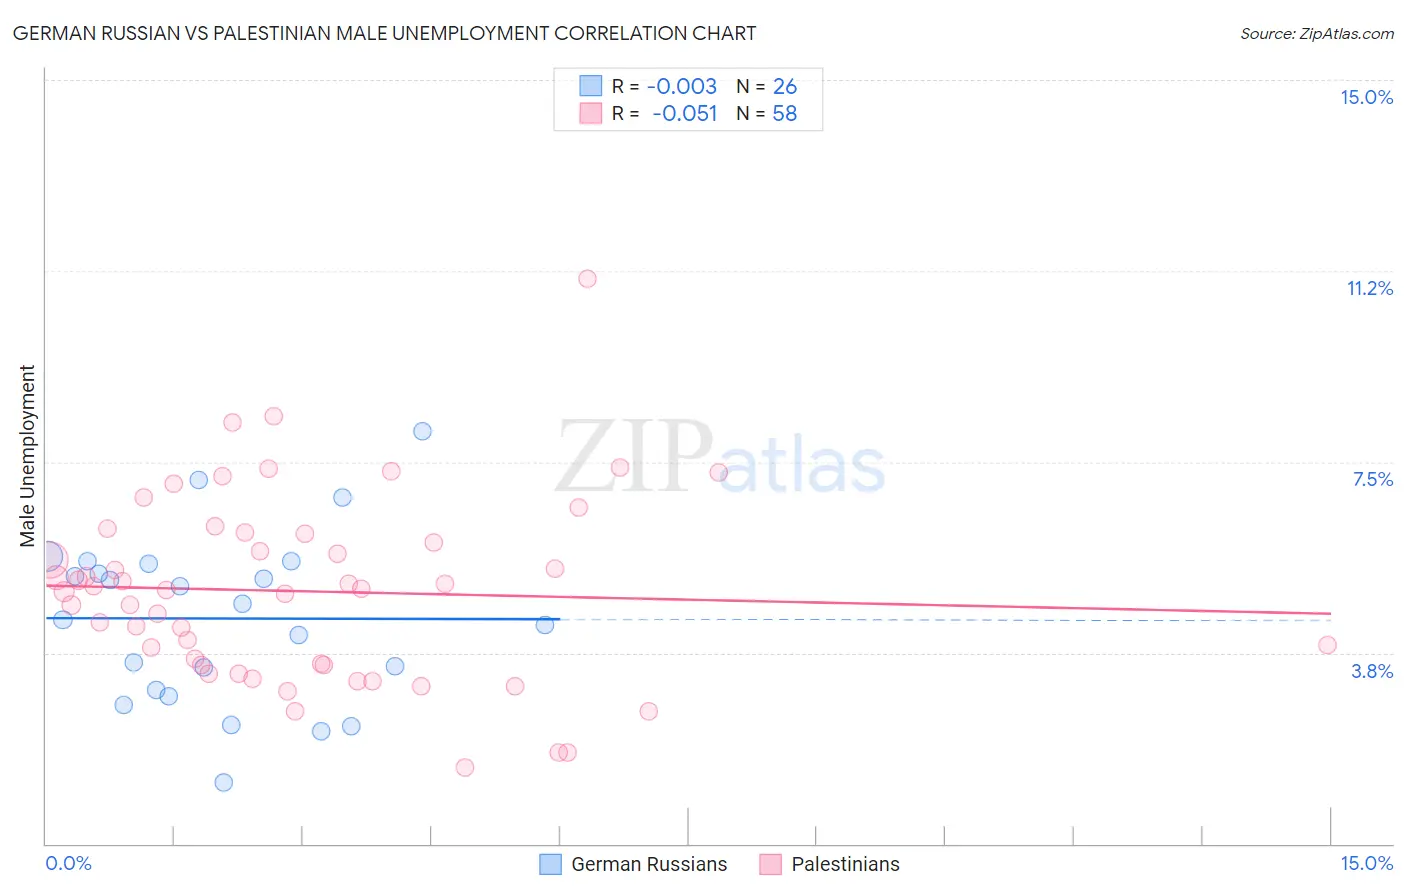
German Russian vs Palestinian Male Unemployment Correlation Chart
The statistical analysis conducted on geographies consisting of 96,273,571 people shows no correlation between the proportion of German Russians and unemployment rate among males in the United States with a correlation coefficient (R) of -0.003 and weighted average of 5.1%. Similarly, the statistical analysis conducted on geographies consisting of 216,271,128 people shows a slight negative correlation between the proportion of Palestinians and unemployment rate among males in the United States with a correlation coefficient (R) of -0.051 and weighted average of 5.1%, a difference of 0.89%.
Male Unemployment Correlation Summary
| Measurement | German Russian | Palestinian |
| Minimum | 1.2% | 1.5% |
| Maximum | 8.1% | 11.1% |
| Range | 6.9% | 9.6% |
| Mean | 4.4% | 5.0% |
| Median | 4.6% | 5.0% |
| Interquartile 25% (IQ1) | 3.0% | 3.5% |
| Interquartile 75% (IQ3) | 5.5% | 6.1% |
| Interquartile Range (IQR) | 2.5% | 2.6% |
| Standard Deviation (Sample) | 1.7% | 1.8% |
| Standard Deviation (Population) | 1.6% | 1.8% |
Similar Demographics by Male Unemployment
Demographics Similar to German Russians by Male Unemployment
In terms of male unemployment, the demographic groups most similar to German Russians are Immigrants from France (5.1%, a difference of 0.020%), Russian (5.1%, a difference of 0.040%), Uruguayan (5.1%, a difference of 0.060%), Immigrants from Kuwait (5.1%, a difference of 0.12%), and Immigrants from Spain (5.1%, a difference of 0.16%).
| Demographics | Rating | Rank | Male Unemployment |
| Canadians | 94.1 /100 | #94 | Exceptional 5.1% |
| Italians | 93.8 /100 | #95 | Exceptional 5.1% |
| Asians | 93.7 /100 | #96 | Exceptional 5.1% |
| Immigrants | Spain | 93.4 /100 | #97 | Exceptional 5.1% |
| Immigrants | Kuwait | 93.3 /100 | #98 | Exceptional 5.1% |
| Uruguayans | 93.0 /100 | #99 | Exceptional 5.1% |
| Russians | 92.9 /100 | #100 | Exceptional 5.1% |
| German Russians | 92.7 /100 | #101 | Exceptional 5.1% |
| Immigrants | France | 92.7 /100 | #102 | Exceptional 5.1% |
| Immigrants | Jordan | 91.9 /100 | #103 | Exceptional 5.1% |
| Immigrants | Chile | 91.8 /100 | #104 | Exceptional 5.1% |
| Immigrants | Czechoslovakia | 91.7 /100 | #105 | Exceptional 5.1% |
| Immigrants | Ethiopia | 91.5 /100 | #106 | Exceptional 5.1% |
| Ethiopians | 91.3 /100 | #107 | Exceptional 5.1% |
| Immigrants | Nicaragua | 91.2 /100 | #108 | Exceptional 5.1% |
Demographics Similar to Palestinians by Male Unemployment
In terms of male unemployment, the demographic groups most similar to Palestinians are Immigrants from Latvia (5.1%, a difference of 0.030%), Nicaraguan (5.1%, a difference of 0.070%), Immigrants from Lithuania (5.1%, a difference of 0.070%), Mongolian (5.1%, a difference of 0.10%), and Ukrainian (5.1%, a difference of 0.11%).
| Demographics | Rating | Rank | Male Unemployment |
| Immigrants | Denmark | 89.4 /100 | #116 | Excellent 5.1% |
| Estonians | 89.0 /100 | #117 | Excellent 5.1% |
| Cypriots | 88.8 /100 | #118 | Excellent 5.1% |
| French Canadians | 88.6 /100 | #119 | Excellent 5.1% |
| Ukrainians | 88.4 /100 | #120 | Excellent 5.1% |
| Mongolians | 88.4 /100 | #121 | Excellent 5.1% |
| Nicaraguans | 88.2 /100 | #122 | Excellent 5.1% |
| Palestinians | 87.7 /100 | #123 | Excellent 5.1% |
| Immigrants | Latvia | 87.5 /100 | #124 | Excellent 5.1% |
| Immigrants | Lithuania | 87.2 /100 | #125 | Excellent 5.1% |
| Immigrants | Colombia | 86.8 /100 | #126 | Excellent 5.1% |
| Immigrants | Brazil | 86.3 /100 | #127 | Excellent 5.2% |
| Hungarians | 85.1 /100 | #128 | Excellent 5.2% |
| Immigrants | Western Europe | 84.8 /100 | #129 | Excellent 5.2% |
| Immigrants | Malaysia | 83.5 /100 | #130 | Excellent 5.2% |