German Russian vs Immigrants from Iraq Unemployment Among Women with Children Ages 6 to 17 years
COMPARE
German Russian
Immigrants from Iraq
Unemployment Among Women with Children Ages 6 to 17 years
Unemployment Among Women with Children Ages 6 to 17 years Comparison
German Russians
Immigrants from Iraq
8.5%
UNEMPLOYMENT AMONG WOMEN WITH CHILDREN AGES 6 TO 17 YEARS
98.6/ 100
METRIC RATING
96th/ 347
METRIC RANK
8.1%
UNEMPLOYMENT AMONG WOMEN WITH CHILDREN AGES 6 TO 17 YEARS
100.0/ 100
METRIC RATING
52nd/ 347
METRIC RANK
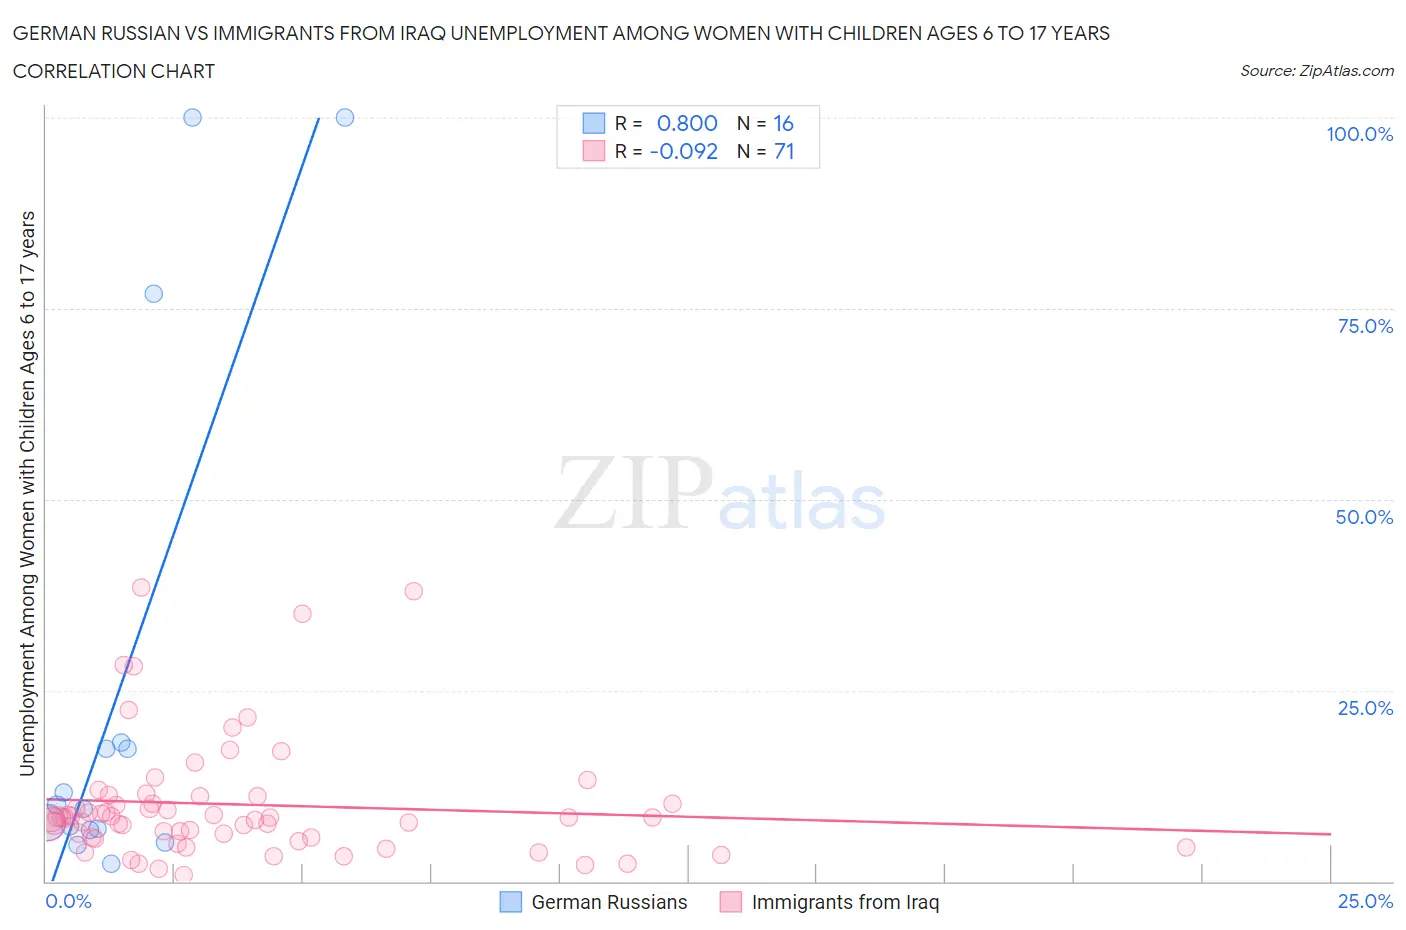
German Russian vs Immigrants from Iraq Unemployment Among Women with Children Ages 6 to 17 years Correlation Chart
The statistical analysis conducted on geographies consisting of 84,307,306 people shows a very strong positive correlation between the proportion of German Russians and unemployment rate among women with children between the ages 6 and 17 in the United States with a correlation coefficient (R) of 0.800 and weighted average of 8.5%. Similarly, the statistical analysis conducted on geographies consisting of 158,568,400 people shows a slight negative correlation between the proportion of Immigrants from Iraq and unemployment rate among women with children between the ages 6 and 17 in the United States with a correlation coefficient (R) of -0.092 and weighted average of 8.1%, a difference of 5.0%.
Unemployment Among Women with Children Ages 6 to 17 years Correlation Summary
| Measurement | German Russian | Immigrants from Iraq |
| Minimum | 2.3% | 0.80% |
| Maximum | 100.0% | 38.4% |
| Range | 97.7% | 37.6% |
| Mean | 25.1% | 10.1% |
| Median | 9.8% | 8.3% |
| Interquartile 25% (IQ1) | 6.8% | 5.7% |
| Interquartile 75% (IQ3) | 17.8% | 11.1% |
| Interquartile Range (IQR) | 11.0% | 5.4% |
| Standard Deviation (Sample) | 34.0% | 7.9% |
| Standard Deviation (Population) | 32.9% | 7.9% |
Similar Demographics by Unemployment Among Women with Children Ages 6 to 17 years
Demographics Similar to German Russians by Unemployment Among Women with Children Ages 6 to 17 years
In terms of unemployment among women with children ages 6 to 17 years, the demographic groups most similar to German Russians are Sri Lankan (8.5%, a difference of 0.070%), Bolivian (8.5%, a difference of 0.090%), Immigrants from Barbados (8.5%, a difference of 0.12%), Malaysian (8.6%, a difference of 0.13%), and Immigrants from Lithuania (8.6%, a difference of 0.21%).
| Demographics | Rating | Rank | Unemployment Among Women with Children Ages 6 to 17 years |
| Paiute | 99.1 /100 | #89 | Exceptional 8.5% |
| Yugoslavians | 99.0 /100 | #90 | Exceptional 8.5% |
| Immigrants | Eastern Europe | 99.0 /100 | #91 | Exceptional 8.5% |
| Potawatomi | 99.0 /100 | #92 | Exceptional 8.5% |
| Australians | 98.9 /100 | #93 | Exceptional 8.5% |
| Immigrants | Barbados | 98.8 /100 | #94 | Exceptional 8.5% |
| Sri Lankans | 98.7 /100 | #95 | Exceptional 8.5% |
| German Russians | 98.6 /100 | #96 | Exceptional 8.5% |
| Bolivians | 98.5 /100 | #97 | Exceptional 8.5% |
| Malaysians | 98.5 /100 | #98 | Exceptional 8.6% |
| Immigrants | Lithuania | 98.4 /100 | #99 | Exceptional 8.6% |
| New Zealanders | 98.4 /100 | #100 | Exceptional 8.6% |
| Immigrants | Pakistan | 98.4 /100 | #101 | Exceptional 8.6% |
| Immigrants | South Africa | 98.3 /100 | #102 | Exceptional 8.6% |
| Scandinavians | 98.3 /100 | #103 | Exceptional 8.6% |
Demographics Similar to Immigrants from Iraq by Unemployment Among Women with Children Ages 6 to 17 years
In terms of unemployment among women with children ages 6 to 17 years, the demographic groups most similar to Immigrants from Iraq are Danish (8.1%, a difference of 0.060%), Immigrants from Armenia (8.2%, a difference of 0.29%), Immigrants from Sudan (8.1%, a difference of 0.30%), Immigrants from Japan (8.2%, a difference of 0.35%), and Immigrants from Bosnia and Herzegovina (8.2%, a difference of 0.36%).
| Demographics | Rating | Rank | Unemployment Among Women with Children Ages 6 to 17 years |
| Immigrants | Bulgaria | 100.0 /100 | #45 | Exceptional 8.1% |
| Icelanders | 100.0 /100 | #46 | Exceptional 8.1% |
| Immigrants | Switzerland | 100.0 /100 | #47 | Exceptional 8.1% |
| Immigrants | Asia | 100.0 /100 | #48 | Exceptional 8.1% |
| Immigrants | Oceania | 100.0 /100 | #49 | Exceptional 8.1% |
| Hawaiians | 100.0 /100 | #50 | Exceptional 8.1% |
| Immigrants | Sudan | 100.0 /100 | #51 | Exceptional 8.1% |
| Immigrants | Iraq | 100.0 /100 | #52 | Exceptional 8.1% |
| Danes | 100.0 /100 | #53 | Exceptional 8.1% |
| Immigrants | Armenia | 100.0 /100 | #54 | Exceptional 8.2% |
| Immigrants | Japan | 100.0 /100 | #55 | Exceptional 8.2% |
| Immigrants | Bosnia and Herzegovina | 100.0 /100 | #56 | Exceptional 8.2% |
| Immigrants | Laos | 100.0 /100 | #57 | Exceptional 8.2% |
| Immigrants | Malaysia | 100.0 /100 | #58 | Exceptional 8.2% |
| Immigrants | Philippines | 100.0 /100 | #59 | Exceptional 8.2% |