Uruguayan vs Immigrants from Iraq Unemployment Among Women with Children Ages 6 to 17 years
COMPARE
Uruguayan
Immigrants from Iraq
Unemployment Among Women with Children Ages 6 to 17 years
Unemployment Among Women with Children Ages 6 to 17 years Comparison
Uruguayans
Immigrants from Iraq
9.3%
UNEMPLOYMENT AMONG WOMEN WITH CHILDREN AGES 6 TO 17 YEARS
3.0/ 100
METRIC RATING
235th/ 347
METRIC RANK
8.1%
UNEMPLOYMENT AMONG WOMEN WITH CHILDREN AGES 6 TO 17 YEARS
100.0/ 100
METRIC RATING
52nd/ 347
METRIC RANK
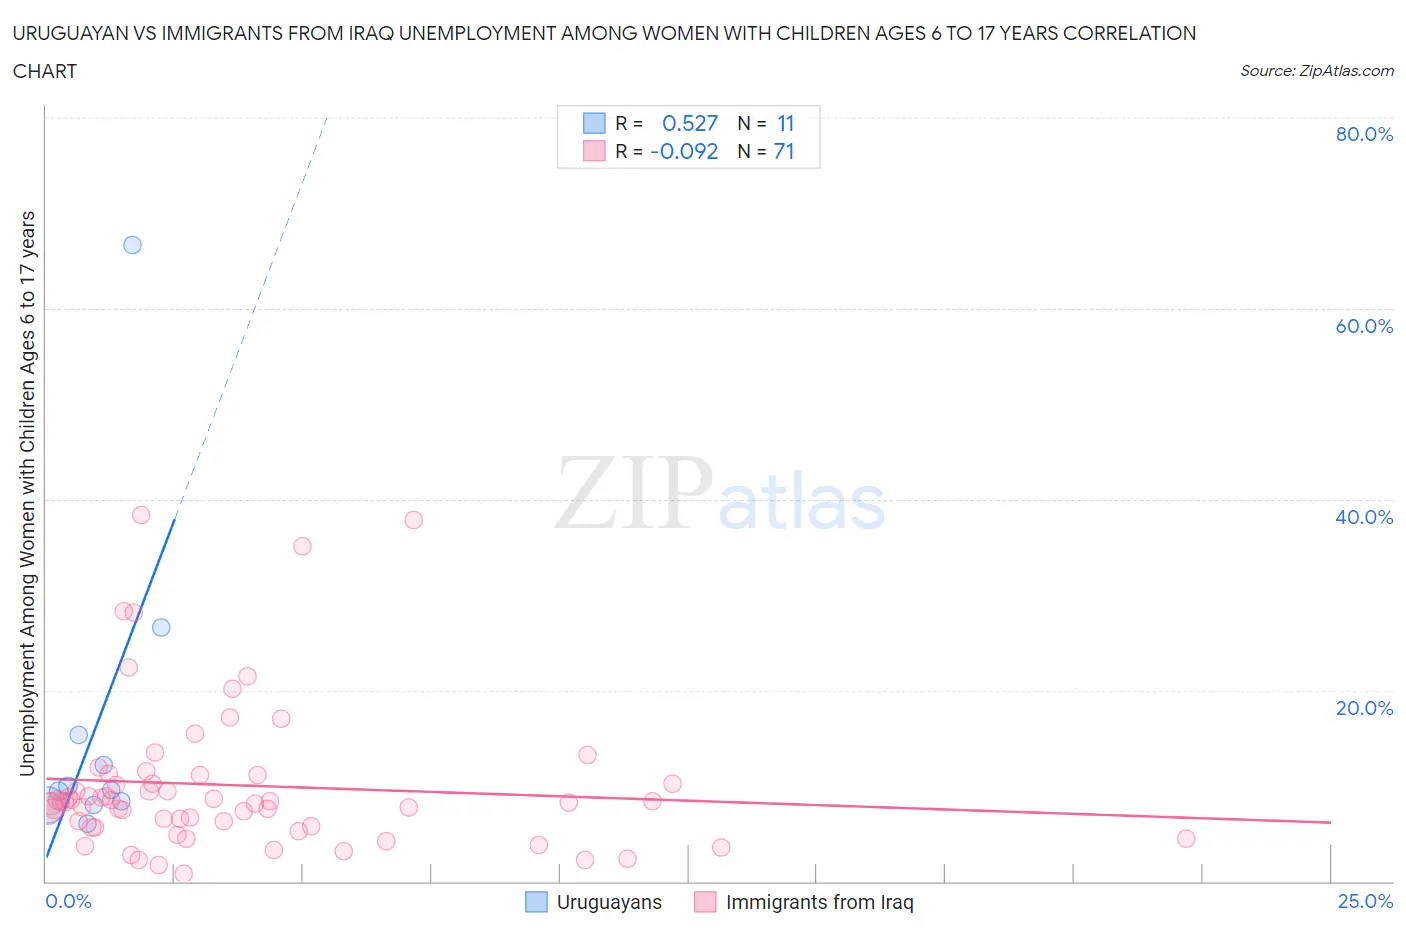
Uruguayan vs Immigrants from Iraq Unemployment Among Women with Children Ages 6 to 17 years Correlation Chart
The statistical analysis conducted on geographies consisting of 121,055,966 people shows a substantial positive correlation between the proportion of Uruguayans and unemployment rate among women with children between the ages 6 and 17 in the United States with a correlation coefficient (R) of 0.527 and weighted average of 9.3%. Similarly, the statistical analysis conducted on geographies consisting of 158,568,400 people shows a slight negative correlation between the proportion of Immigrants from Iraq and unemployment rate among women with children between the ages 6 and 17 in the United States with a correlation coefficient (R) of -0.092 and weighted average of 8.1%, a difference of 14.5%.
Unemployment Among Women with Children Ages 6 to 17 years Correlation Summary
| Measurement | Uruguayan | Immigrants from Iraq |
| Minimum | 6.0% | 0.80% |
| Maximum | 66.7% | 38.4% |
| Range | 60.6% | 37.6% |
| Mean | 16.4% | 10.1% |
| Median | 9.6% | 8.3% |
| Interquartile 25% (IQ1) | 8.0% | 5.7% |
| Interquartile 75% (IQ3) | 15.4% | 11.1% |
| Interquartile Range (IQR) | 7.4% | 5.4% |
| Standard Deviation (Sample) | 17.6% | 7.9% |
| Standard Deviation (Population) | 16.8% | 7.9% |
Similar Demographics by Unemployment Among Women with Children Ages 6 to 17 years
Demographics Similar to Uruguayans by Unemployment Among Women with Children Ages 6 to 17 years
In terms of unemployment among women with children ages 6 to 17 years, the demographic groups most similar to Uruguayans are Hungarian (9.3%, a difference of 0.030%), Mexican (9.3%, a difference of 0.070%), Immigrants from Belize (9.3%, a difference of 0.070%), Immigrants from St. Vincent and the Grenadines (9.3%, a difference of 0.10%), and Arab (9.3%, a difference of 0.15%).
| Demographics | Rating | Rank | Unemployment Among Women with Children Ages 6 to 17 years |
| Estonians | 4.4 /100 | #228 | Tragic 9.3% |
| Lumbee | 4.3 /100 | #229 | Tragic 9.3% |
| Welsh | 4.0 /100 | #230 | Tragic 9.3% |
| Macedonians | 3.9 /100 | #231 | Tragic 9.3% |
| French American Indians | 3.7 /100 | #232 | Tragic 9.3% |
| Immigrants | St. Vincent and the Grenadines | 3.3 /100 | #233 | Tragic 9.3% |
| Mexicans | 3.2 /100 | #234 | Tragic 9.3% |
| Uruguayans | 3.0 /100 | #235 | Tragic 9.3% |
| Hungarians | 3.0 /100 | #236 | Tragic 9.3% |
| Immigrants | Belize | 2.8 /100 | #237 | Tragic 9.3% |
| Arabs | 2.7 /100 | #238 | Tragic 9.3% |
| Immigrants | Saudi Arabia | 2.7 /100 | #239 | Tragic 9.3% |
| Guatemalans | 2.3 /100 | #240 | Tragic 9.3% |
| Colombians | 2.2 /100 | #241 | Tragic 9.3% |
| Immigrants | Colombia | 2.1 /100 | #242 | Tragic 9.3% |
Demographics Similar to Immigrants from Iraq by Unemployment Among Women with Children Ages 6 to 17 years
In terms of unemployment among women with children ages 6 to 17 years, the demographic groups most similar to Immigrants from Iraq are Danish (8.1%, a difference of 0.060%), Immigrants from Armenia (8.2%, a difference of 0.29%), Immigrants from Sudan (8.1%, a difference of 0.30%), Immigrants from Japan (8.2%, a difference of 0.35%), and Immigrants from Bosnia and Herzegovina (8.2%, a difference of 0.36%).
| Demographics | Rating | Rank | Unemployment Among Women with Children Ages 6 to 17 years |
| Immigrants | Bulgaria | 100.0 /100 | #45 | Exceptional 8.1% |
| Icelanders | 100.0 /100 | #46 | Exceptional 8.1% |
| Immigrants | Switzerland | 100.0 /100 | #47 | Exceptional 8.1% |
| Immigrants | Asia | 100.0 /100 | #48 | Exceptional 8.1% |
| Immigrants | Oceania | 100.0 /100 | #49 | Exceptional 8.1% |
| Hawaiians | 100.0 /100 | #50 | Exceptional 8.1% |
| Immigrants | Sudan | 100.0 /100 | #51 | Exceptional 8.1% |
| Immigrants | Iraq | 100.0 /100 | #52 | Exceptional 8.1% |
| Danes | 100.0 /100 | #53 | Exceptional 8.1% |
| Immigrants | Armenia | 100.0 /100 | #54 | Exceptional 8.2% |
| Immigrants | Japan | 100.0 /100 | #55 | Exceptional 8.2% |
| Immigrants | Bosnia and Herzegovina | 100.0 /100 | #56 | Exceptional 8.2% |
| Immigrants | Laos | 100.0 /100 | #57 | Exceptional 8.2% |
| Immigrants | Malaysia | 100.0 /100 | #58 | Exceptional 8.2% |
| Immigrants | Philippines | 100.0 /100 | #59 | Exceptional 8.2% |