South American vs Immigrants from Iraq Unemployment Among Women with Children Ages 6 to 17 years
COMPARE
South American
Immigrants from Iraq
Unemployment Among Women with Children Ages 6 to 17 years
Unemployment Among Women with Children Ages 6 to 17 years Comparison
South Americans
Immigrants from Iraq
9.5%
UNEMPLOYMENT AMONG WOMEN WITH CHILDREN AGES 6 TO 17 YEARS
0.5/ 100
METRIC RATING
261st/ 347
METRIC RANK
8.1%
UNEMPLOYMENT AMONG WOMEN WITH CHILDREN AGES 6 TO 17 YEARS
100.0/ 100
METRIC RATING
52nd/ 347
METRIC RANK
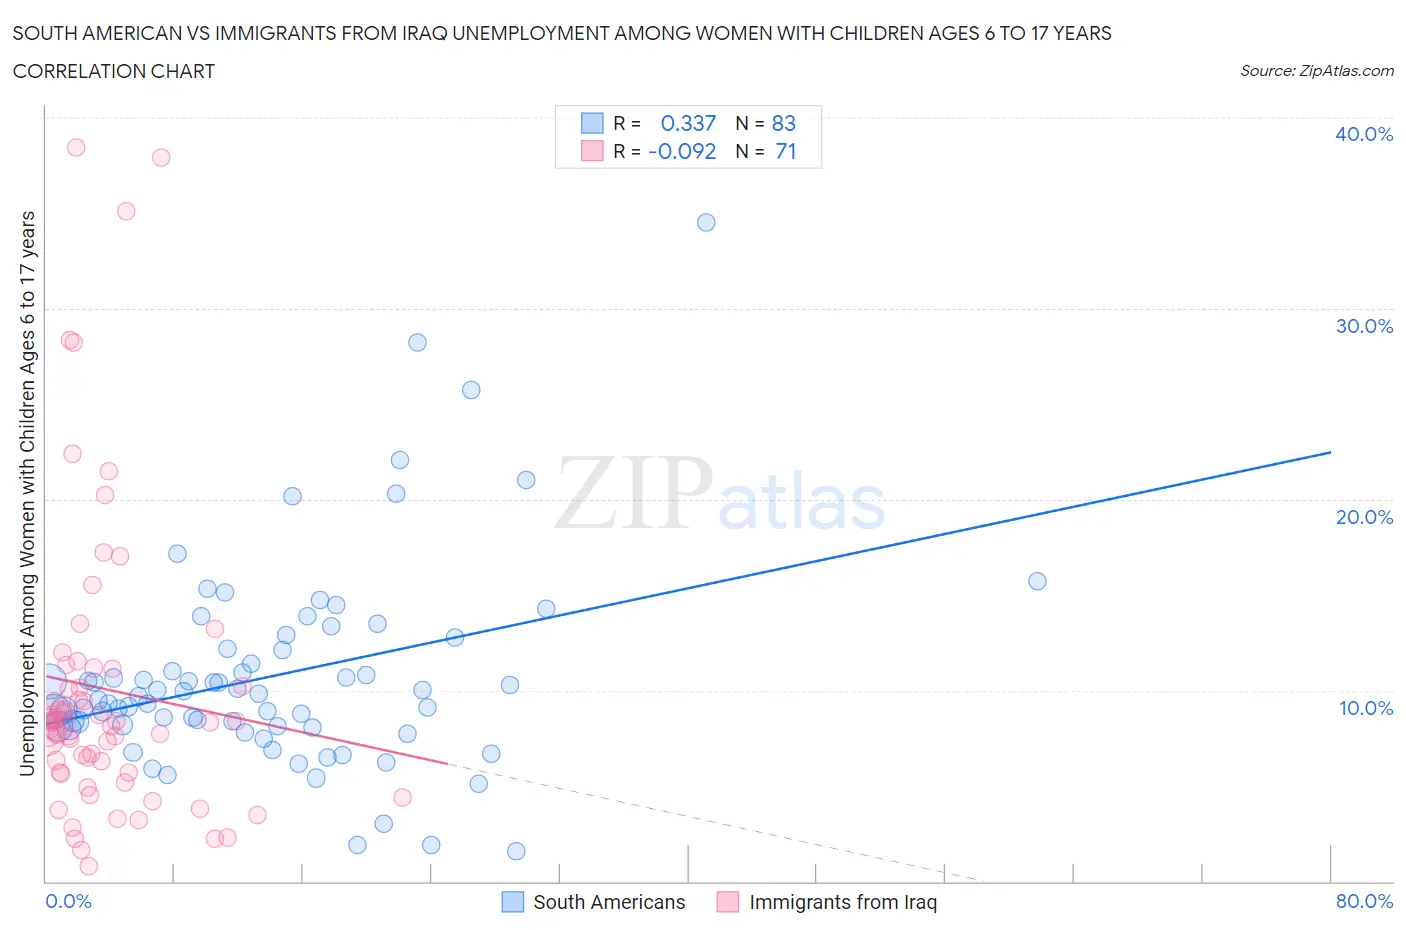
South American vs Immigrants from Iraq Unemployment Among Women with Children Ages 6 to 17 years Correlation Chart
The statistical analysis conducted on geographies consisting of 336,338,597 people shows a mild positive correlation between the proportion of South Americans and unemployment rate among women with children between the ages 6 and 17 in the United States with a correlation coefficient (R) of 0.337 and weighted average of 9.5%. Similarly, the statistical analysis conducted on geographies consisting of 158,568,400 people shows a slight negative correlation between the proportion of Immigrants from Iraq and unemployment rate among women with children between the ages 6 and 17 in the United States with a correlation coefficient (R) of -0.092 and weighted average of 8.1%, a difference of 16.7%.
Unemployment Among Women with Children Ages 6 to 17 years Correlation Summary
| Measurement | South American | Immigrants from Iraq |
| Minimum | 1.6% | 0.80% |
| Maximum | 34.5% | 38.4% |
| Range | 32.9% | 37.6% |
| Mean | 10.7% | 10.1% |
| Median | 9.7% | 8.3% |
| Interquartile 25% (IQ1) | 8.1% | 5.7% |
| Interquartile 75% (IQ3) | 12.2% | 11.1% |
| Interquartile Range (IQR) | 4.1% | 5.4% |
| Standard Deviation (Sample) | 5.4% | 7.9% |
| Standard Deviation (Population) | 5.3% | 7.9% |
Similar Demographics by Unemployment Among Women with Children Ages 6 to 17 years
Demographics Similar to South Americans by Unemployment Among Women with Children Ages 6 to 17 years
In terms of unemployment among women with children ages 6 to 17 years, the demographic groups most similar to South Americans are Senegalese (9.5%, a difference of 0.050%), Italian (9.5%, a difference of 0.080%), Lebanese (9.5%, a difference of 0.090%), Immigrants from Central America (9.5%, a difference of 0.19%), and Immigrants from Mexico (9.5%, a difference of 0.29%).
| Demographics | Rating | Rank | Unemployment Among Women with Children Ages 6 to 17 years |
| Nicaraguans | 1.0 /100 | #254 | Tragic 9.4% |
| Lithuanians | 0.9 /100 | #255 | Tragic 9.4% |
| Canadians | 0.8 /100 | #256 | Tragic 9.4% |
| Celtics | 0.7 /100 | #257 | Tragic 9.5% |
| Immigrants | Mexico | 0.7 /100 | #258 | Tragic 9.5% |
| Immigrants | Central America | 0.6 /100 | #259 | Tragic 9.5% |
| Italians | 0.6 /100 | #260 | Tragic 9.5% |
| South Americans | 0.5 /100 | #261 | Tragic 9.5% |
| Senegalese | 0.5 /100 | #262 | Tragic 9.5% |
| Lebanese | 0.5 /100 | #263 | Tragic 9.5% |
| Immigrants | Ghana | 0.4 /100 | #264 | Tragic 9.5% |
| West Indians | 0.4 /100 | #265 | Tragic 9.5% |
| Immigrants | Jamaica | 0.3 /100 | #266 | Tragic 9.5% |
| Irish | 0.3 /100 | #267 | Tragic 9.5% |
| Ghanaians | 0.2 /100 | #268 | Tragic 9.6% |
Demographics Similar to Immigrants from Iraq by Unemployment Among Women with Children Ages 6 to 17 years
In terms of unemployment among women with children ages 6 to 17 years, the demographic groups most similar to Immigrants from Iraq are Danish (8.1%, a difference of 0.060%), Immigrants from Armenia (8.2%, a difference of 0.29%), Immigrants from Sudan (8.1%, a difference of 0.30%), Immigrants from Japan (8.2%, a difference of 0.35%), and Immigrants from Bosnia and Herzegovina (8.2%, a difference of 0.36%).
| Demographics | Rating | Rank | Unemployment Among Women with Children Ages 6 to 17 years |
| Immigrants | Bulgaria | 100.0 /100 | #45 | Exceptional 8.1% |
| Icelanders | 100.0 /100 | #46 | Exceptional 8.1% |
| Immigrants | Switzerland | 100.0 /100 | #47 | Exceptional 8.1% |
| Immigrants | Asia | 100.0 /100 | #48 | Exceptional 8.1% |
| Immigrants | Oceania | 100.0 /100 | #49 | Exceptional 8.1% |
| Hawaiians | 100.0 /100 | #50 | Exceptional 8.1% |
| Immigrants | Sudan | 100.0 /100 | #51 | Exceptional 8.1% |
| Immigrants | Iraq | 100.0 /100 | #52 | Exceptional 8.1% |
| Danes | 100.0 /100 | #53 | Exceptional 8.1% |
| Immigrants | Armenia | 100.0 /100 | #54 | Exceptional 8.2% |
| Immigrants | Japan | 100.0 /100 | #55 | Exceptional 8.2% |
| Immigrants | Bosnia and Herzegovina | 100.0 /100 | #56 | Exceptional 8.2% |
| Immigrants | Laos | 100.0 /100 | #57 | Exceptional 8.2% |
| Immigrants | Malaysia | 100.0 /100 | #58 | Exceptional 8.2% |
| Immigrants | Philippines | 100.0 /100 | #59 | Exceptional 8.2% |