German Russian vs Cuban Unemployment Among Women with Children Ages 6 to 17 years
COMPARE
German Russian
Cuban
Unemployment Among Women with Children Ages 6 to 17 years
Unemployment Among Women with Children Ages 6 to 17 years Comparison
German Russians
Cubans
8.5%
UNEMPLOYMENT AMONG WOMEN WITH CHILDREN AGES 6 TO 17 YEARS
98.6/ 100
METRIC RATING
96th/ 347
METRIC RANK
9.2%
UNEMPLOYMENT AMONG WOMEN WITH CHILDREN AGES 6 TO 17 YEARS
10.9/ 100
METRIC RATING
207th/ 347
METRIC RANK
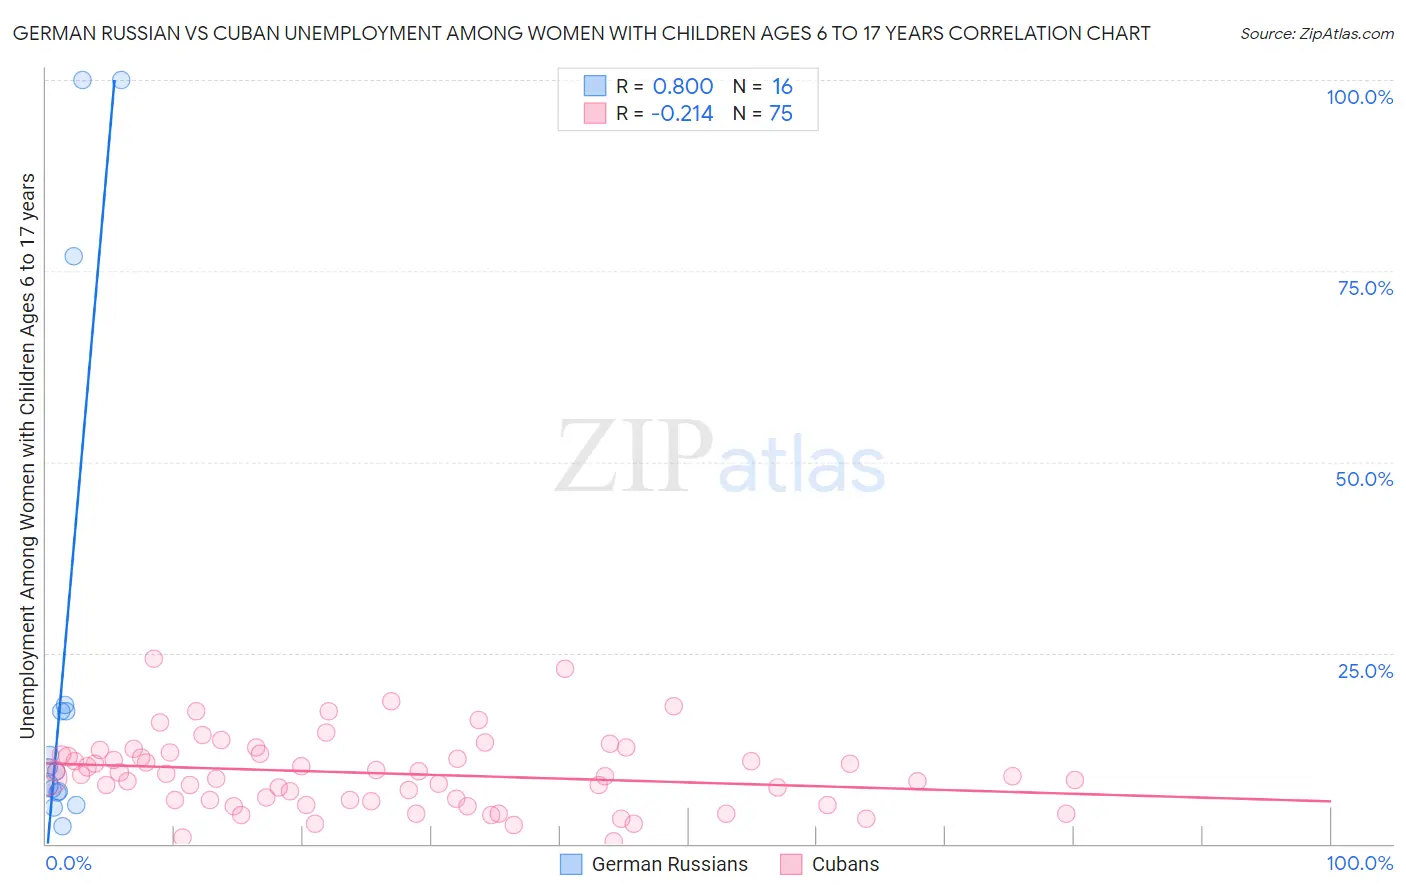
German Russian vs Cuban Unemployment Among Women with Children Ages 6 to 17 years Correlation Chart
The statistical analysis conducted on geographies consisting of 84,307,306 people shows a very strong positive correlation between the proportion of German Russians and unemployment rate among women with children between the ages 6 and 17 in the United States with a correlation coefficient (R) of 0.800 and weighted average of 8.5%. Similarly, the statistical analysis conducted on geographies consisting of 317,366,594 people shows a weak negative correlation between the proportion of Cubans and unemployment rate among women with children between the ages 6 and 17 in the United States with a correlation coefficient (R) of -0.214 and weighted average of 9.2%, a difference of 7.4%.
Unemployment Among Women with Children Ages 6 to 17 years Correlation Summary
| Measurement | German Russian | Cuban |
| Minimum | 2.3% | 0.30% |
| Maximum | 100.0% | 24.1% |
| Range | 97.7% | 23.8% |
| Mean | 25.1% | 9.2% |
| Median | 9.8% | 8.9% |
| Interquartile 25% (IQ1) | 6.8% | 5.7% |
| Interquartile 75% (IQ3) | 17.8% | 11.8% |
| Interquartile Range (IQR) | 11.0% | 6.1% |
| Standard Deviation (Sample) | 34.0% | 4.8% |
| Standard Deviation (Population) | 32.9% | 4.8% |
Similar Demographics by Unemployment Among Women with Children Ages 6 to 17 years
Demographics Similar to German Russians by Unemployment Among Women with Children Ages 6 to 17 years
In terms of unemployment among women with children ages 6 to 17 years, the demographic groups most similar to German Russians are Sri Lankan (8.5%, a difference of 0.070%), Bolivian (8.5%, a difference of 0.090%), Immigrants from Barbados (8.5%, a difference of 0.12%), Malaysian (8.6%, a difference of 0.13%), and Immigrants from Lithuania (8.6%, a difference of 0.21%).
| Demographics | Rating | Rank | Unemployment Among Women with Children Ages 6 to 17 years |
| Paiute | 99.1 /100 | #89 | Exceptional 8.5% |
| Yugoslavians | 99.0 /100 | #90 | Exceptional 8.5% |
| Immigrants | Eastern Europe | 99.0 /100 | #91 | Exceptional 8.5% |
| Potawatomi | 99.0 /100 | #92 | Exceptional 8.5% |
| Australians | 98.9 /100 | #93 | Exceptional 8.5% |
| Immigrants | Barbados | 98.8 /100 | #94 | Exceptional 8.5% |
| Sri Lankans | 98.7 /100 | #95 | Exceptional 8.5% |
| German Russians | 98.6 /100 | #96 | Exceptional 8.5% |
| Bolivians | 98.5 /100 | #97 | Exceptional 8.5% |
| Malaysians | 98.5 /100 | #98 | Exceptional 8.6% |
| Immigrants | Lithuania | 98.4 /100 | #99 | Exceptional 8.6% |
| New Zealanders | 98.4 /100 | #100 | Exceptional 8.6% |
| Immigrants | Pakistan | 98.4 /100 | #101 | Exceptional 8.6% |
| Immigrants | South Africa | 98.3 /100 | #102 | Exceptional 8.6% |
| Scandinavians | 98.3 /100 | #103 | Exceptional 8.6% |
Demographics Similar to Cubans by Unemployment Among Women with Children Ages 6 to 17 years
In terms of unemployment among women with children ages 6 to 17 years, the demographic groups most similar to Cubans are Immigrants from Peru (9.2%, a difference of 0.010%), Salvadoran (9.2%, a difference of 0.010%), Finnish (9.2%, a difference of 0.10%), Immigrants from Cuba (9.2%, a difference of 0.15%), and Immigrants from North America (9.2%, a difference of 0.20%).
| Demographics | Rating | Rank | Unemployment Among Women with Children Ages 6 to 17 years |
| Trinidadians and Tobagonians | 18.2 /100 | #200 | Poor 9.1% |
| Immigrants | Trinidad and Tobago | 16.7 /100 | #201 | Poor 9.1% |
| Immigrants | Middle Africa | 15.6 /100 | #202 | Poor 9.1% |
| Maltese | 15.3 /100 | #203 | Poor 9.1% |
| Immigrants | Canada | 15.3 /100 | #204 | Poor 9.1% |
| Immigrants | Western Europe | 14.1 /100 | #205 | Poor 9.1% |
| Immigrants | North America | 12.7 /100 | #206 | Poor 9.2% |
| Cubans | 10.9 /100 | #207 | Poor 9.2% |
| Immigrants | Peru | 10.8 /100 | #208 | Poor 9.2% |
| Salvadorans | 10.7 /100 | #209 | Poor 9.2% |
| Finns | 10.0 /100 | #210 | Tragic 9.2% |
| Immigrants | Cuba | 9.6 /100 | #211 | Tragic 9.2% |
| Peruvians | 9.0 /100 | #212 | Tragic 9.2% |
| Spaniards | 8.2 /100 | #213 | Tragic 9.2% |
| Iroquois | 7.5 /100 | #214 | Tragic 9.2% |