German Russian vs Estonian Unemployment Among Women with Children Ages 6 to 17 years
COMPARE
German Russian
Estonian
Unemployment Among Women with Children Ages 6 to 17 years
Unemployment Among Women with Children Ages 6 to 17 years Comparison
German Russians
Estonians
8.5%
UNEMPLOYMENT AMONG WOMEN WITH CHILDREN AGES 6 TO 17 YEARS
98.6/ 100
METRIC RATING
96th/ 347
METRIC RANK
9.3%
UNEMPLOYMENT AMONG WOMEN WITH CHILDREN AGES 6 TO 17 YEARS
4.4/ 100
METRIC RATING
228th/ 347
METRIC RANK
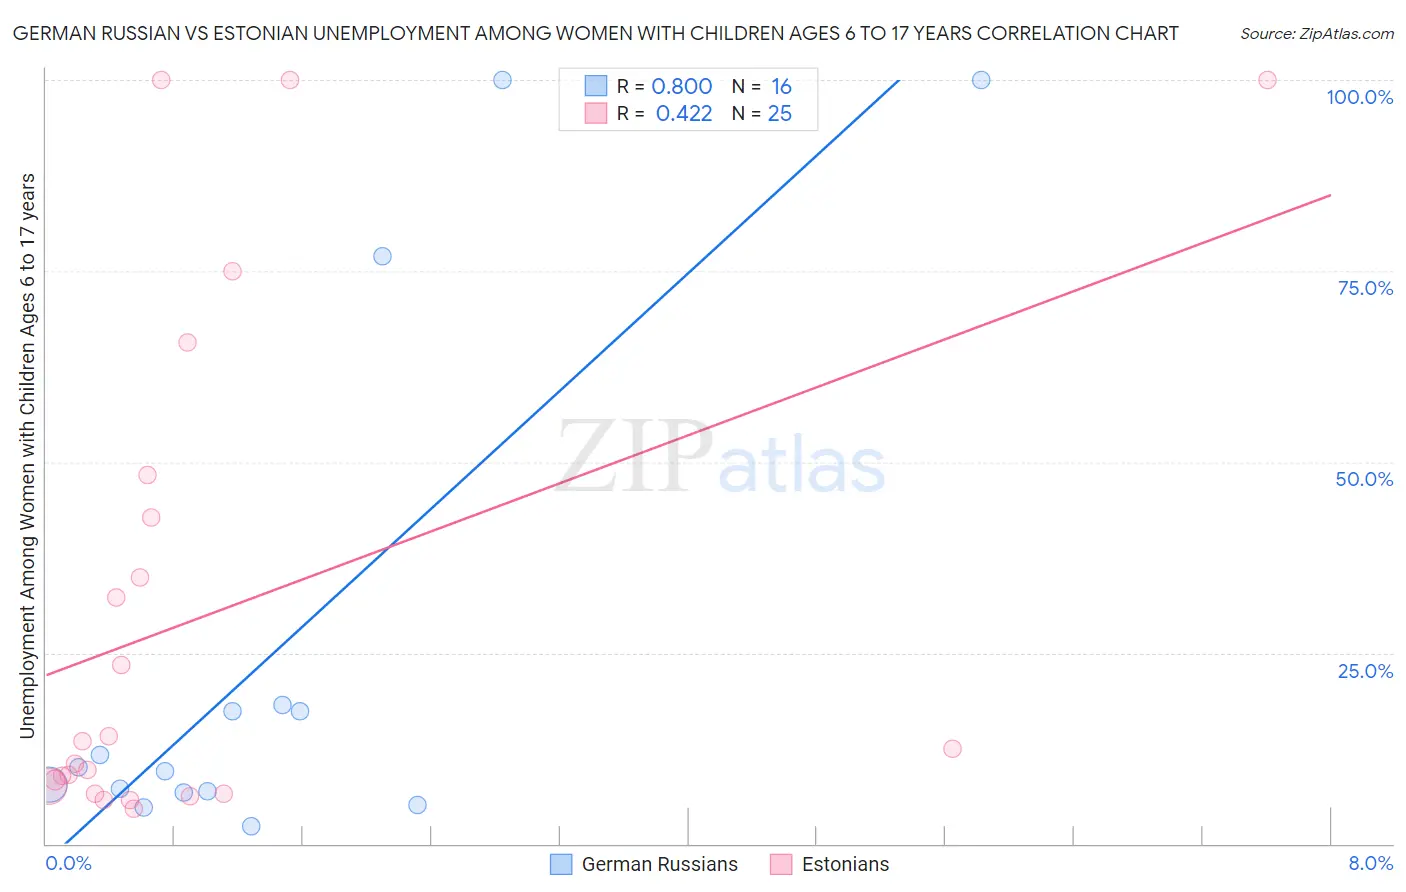
German Russian vs Estonian Unemployment Among Women with Children Ages 6 to 17 years Correlation Chart
The statistical analysis conducted on geographies consisting of 84,307,306 people shows a very strong positive correlation between the proportion of German Russians and unemployment rate among women with children between the ages 6 and 17 in the United States with a correlation coefficient (R) of 0.800 and weighted average of 8.5%. Similarly, the statistical analysis conducted on geographies consisting of 102,254,464 people shows a moderate positive correlation between the proportion of Estonians and unemployment rate among women with children between the ages 6 and 17 in the United States with a correlation coefficient (R) of 0.422 and weighted average of 9.3%, a difference of 8.6%.
Unemployment Among Women with Children Ages 6 to 17 years Correlation Summary
| Measurement | German Russian | Estonian |
| Minimum | 2.3% | 4.5% |
| Maximum | 100.0% | 100.0% |
| Range | 97.7% | 95.5% |
| Mean | 25.1% | 30.0% |
| Median | 9.8% | 12.5% |
| Interquartile 25% (IQ1) | 6.8% | 7.0% |
| Interquartile 75% (IQ3) | 17.8% | 45.5% |
| Interquartile Range (IQR) | 11.0% | 38.5% |
| Standard Deviation (Sample) | 34.0% | 32.6% |
| Standard Deviation (Population) | 32.9% | 32.0% |
Similar Demographics by Unemployment Among Women with Children Ages 6 to 17 years
Demographics Similar to German Russians by Unemployment Among Women with Children Ages 6 to 17 years
In terms of unemployment among women with children ages 6 to 17 years, the demographic groups most similar to German Russians are Sri Lankan (8.5%, a difference of 0.070%), Bolivian (8.5%, a difference of 0.090%), Immigrants from Barbados (8.5%, a difference of 0.12%), Malaysian (8.6%, a difference of 0.13%), and Immigrants from Lithuania (8.6%, a difference of 0.21%).
| Demographics | Rating | Rank | Unemployment Among Women with Children Ages 6 to 17 years |
| Paiute | 99.1 /100 | #89 | Exceptional 8.5% |
| Yugoslavians | 99.0 /100 | #90 | Exceptional 8.5% |
| Immigrants | Eastern Europe | 99.0 /100 | #91 | Exceptional 8.5% |
| Potawatomi | 99.0 /100 | #92 | Exceptional 8.5% |
| Australians | 98.9 /100 | #93 | Exceptional 8.5% |
| Immigrants | Barbados | 98.8 /100 | #94 | Exceptional 8.5% |
| Sri Lankans | 98.7 /100 | #95 | Exceptional 8.5% |
| German Russians | 98.6 /100 | #96 | Exceptional 8.5% |
| Bolivians | 98.5 /100 | #97 | Exceptional 8.5% |
| Malaysians | 98.5 /100 | #98 | Exceptional 8.6% |
| Immigrants | Lithuania | 98.4 /100 | #99 | Exceptional 8.6% |
| New Zealanders | 98.4 /100 | #100 | Exceptional 8.6% |
| Immigrants | Pakistan | 98.4 /100 | #101 | Exceptional 8.6% |
| Immigrants | South Africa | 98.3 /100 | #102 | Exceptional 8.6% |
| Scandinavians | 98.3 /100 | #103 | Exceptional 8.6% |
Demographics Similar to Estonians by Unemployment Among Women with Children Ages 6 to 17 years
In terms of unemployment among women with children ages 6 to 17 years, the demographic groups most similar to Estonians are Panamanian (9.3%, a difference of 0.020%), Lumbee (9.3%, a difference of 0.030%), Immigrants from the Azores (9.3%, a difference of 0.050%), Welsh (9.3%, a difference of 0.13%), and Macedonian (9.3%, a difference of 0.14%).
| Demographics | Rating | Rank | Unemployment Among Women with Children Ages 6 to 17 years |
| Crow | 5.8 /100 | #221 | Tragic 9.2% |
| Immigrants | Southern Europe | 5.8 /100 | #222 | Tragic 9.2% |
| Immigrants | Eritrea | 5.8 /100 | #223 | Tragic 9.2% |
| Immigrants | El Salvador | 5.3 /100 | #224 | Tragic 9.3% |
| Chinese | 5.2 /100 | #225 | Tragic 9.3% |
| Immigrants | Azores | 4.6 /100 | #226 | Tragic 9.3% |
| Panamanians | 4.5 /100 | #227 | Tragic 9.3% |
| Estonians | 4.4 /100 | #228 | Tragic 9.3% |
| Lumbee | 4.3 /100 | #229 | Tragic 9.3% |
| Welsh | 4.0 /100 | #230 | Tragic 9.3% |
| Macedonians | 3.9 /100 | #231 | Tragic 9.3% |
| French American Indians | 3.7 /100 | #232 | Tragic 9.3% |
| Immigrants | St. Vincent and the Grenadines | 3.3 /100 | #233 | Tragic 9.3% |
| Mexicans | 3.2 /100 | #234 | Tragic 9.3% |
| Uruguayans | 3.0 /100 | #235 | Tragic 9.3% |