Filipino vs German Russian Unemployment Among Women with Children Ages 6 to 17 years
COMPARE
Filipino
German Russian
Unemployment Among Women with Children Ages 6 to 17 years
Unemployment Among Women with Children Ages 6 to 17 years Comparison
Filipinos
German Russians
7.6%
UNEMPLOYMENT AMONG WOMEN WITH CHILDREN AGES 6 TO 17 YEARS
100.0/ 100
METRIC RATING
19th/ 347
METRIC RANK
8.5%
UNEMPLOYMENT AMONG WOMEN WITH CHILDREN AGES 6 TO 17 YEARS
98.6/ 100
METRIC RATING
96th/ 347
METRIC RANK
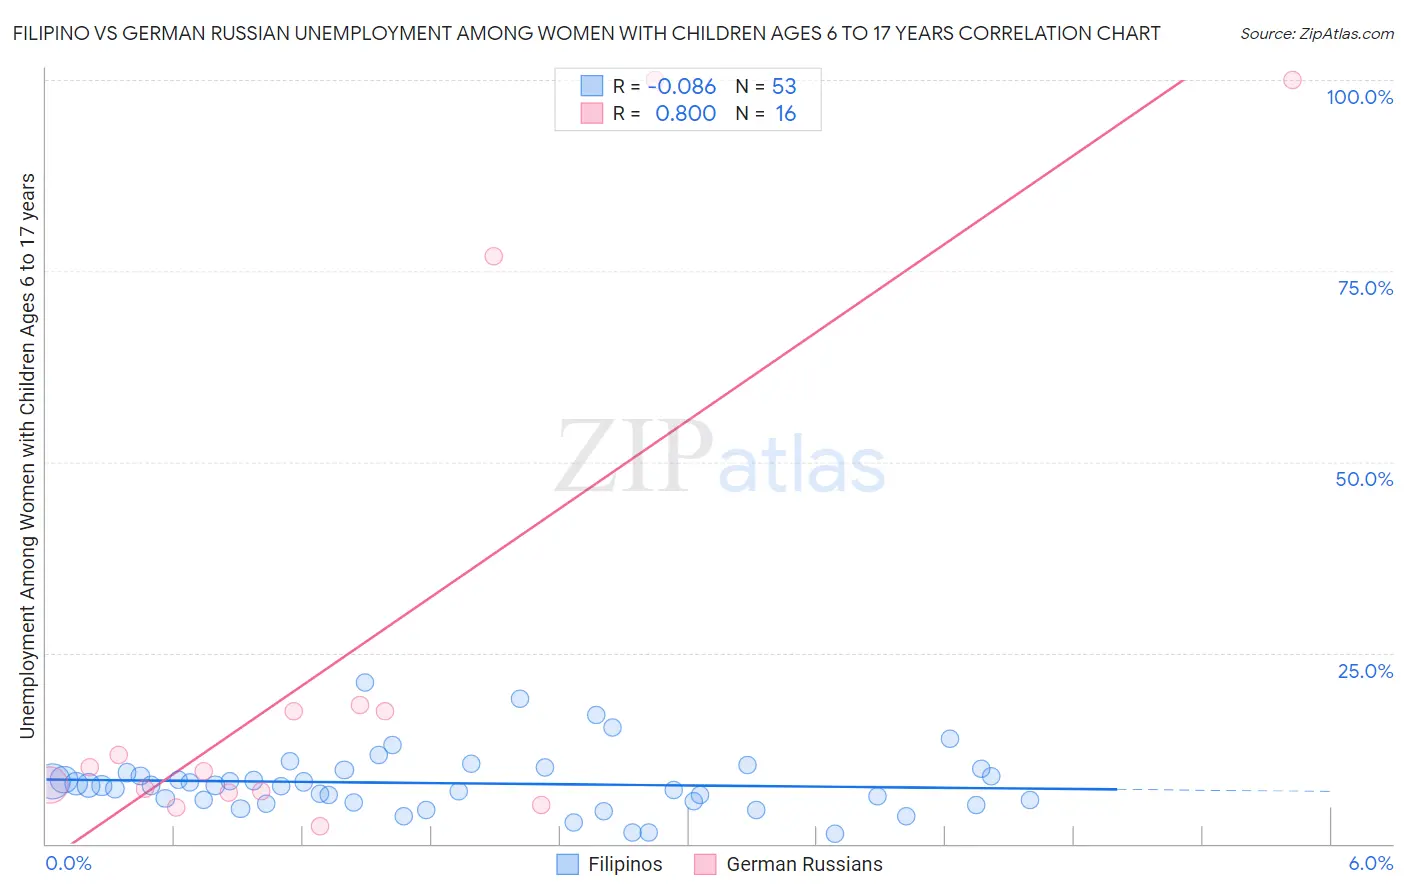
Filipino vs German Russian Unemployment Among Women with Children Ages 6 to 17 years Correlation Chart
The statistical analysis conducted on geographies consisting of 196,913,361 people shows a slight negative correlation between the proportion of Filipinos and unemployment rate among women with children between the ages 6 and 17 in the United States with a correlation coefficient (R) of -0.086 and weighted average of 7.6%. Similarly, the statistical analysis conducted on geographies consisting of 84,307,306 people shows a very strong positive correlation between the proportion of German Russians and unemployment rate among women with children between the ages 6 and 17 in the United States with a correlation coefficient (R) of 0.800 and weighted average of 8.5%, a difference of 12.7%.
Unemployment Among Women with Children Ages 6 to 17 years Correlation Summary
| Measurement | Filipino | German Russian |
| Minimum | 1.3% | 2.3% |
| Maximum | 21.1% | 100.0% |
| Range | 19.8% | 97.7% |
| Mean | 7.9% | 25.1% |
| Median | 7.6% | 9.8% |
| Interquartile 25% (IQ1) | 5.5% | 6.8% |
| Interquartile 75% (IQ3) | 9.5% | 17.8% |
| Interquartile Range (IQR) | 4.0% | 11.0% |
| Standard Deviation (Sample) | 4.0% | 34.0% |
| Standard Deviation (Population) | 3.9% | 32.9% |
Similar Demographics by Unemployment Among Women with Children Ages 6 to 17 years
Demographics Similar to Filipinos by Unemployment Among Women with Children Ages 6 to 17 years
In terms of unemployment among women with children ages 6 to 17 years, the demographic groups most similar to Filipinos are Afghan (7.6%, a difference of 0.020%), Cambodian (7.5%, a difference of 0.68%), Immigrants from Burma/Myanmar (7.5%, a difference of 0.86%), Immigrants from Singapore (7.7%, a difference of 1.0%), and Immigrants from India (7.7%, a difference of 1.1%).
| Demographics | Rating | Rank | Unemployment Among Women with Children Ages 6 to 17 years |
| Bangladeshis | 100.0 /100 | #12 | Exceptional 7.4% |
| Indonesians | 100.0 /100 | #13 | Exceptional 7.4% |
| Sudanese | 100.0 /100 | #14 | Exceptional 7.4% |
| Puget Sound Salish | 100.0 /100 | #15 | Exceptional 7.5% |
| Immigrants | Burma/Myanmar | 100.0 /100 | #16 | Exceptional 7.5% |
| Cambodians | 100.0 /100 | #17 | Exceptional 7.5% |
| Afghans | 100.0 /100 | #18 | Exceptional 7.6% |
| Filipinos | 100.0 /100 | #19 | Exceptional 7.6% |
| Immigrants | Singapore | 100.0 /100 | #20 | Exceptional 7.7% |
| Immigrants | India | 100.0 /100 | #21 | Exceptional 7.7% |
| Immigrants | China | 100.0 /100 | #22 | Exceptional 7.7% |
| Immigrants | Indonesia | 100.0 /100 | #23 | Exceptional 7.7% |
| Nepalese | 100.0 /100 | #24 | Exceptional 7.7% |
| Immigrants | Eastern Asia | 100.0 /100 | #25 | Exceptional 7.7% |
| Indians (Asian) | 100.0 /100 | #26 | Exceptional 7.7% |
Demographics Similar to German Russians by Unemployment Among Women with Children Ages 6 to 17 years
In terms of unemployment among women with children ages 6 to 17 years, the demographic groups most similar to German Russians are Sri Lankan (8.5%, a difference of 0.070%), Bolivian (8.5%, a difference of 0.090%), Immigrants from Barbados (8.5%, a difference of 0.12%), Malaysian (8.6%, a difference of 0.13%), and Immigrants from Lithuania (8.6%, a difference of 0.21%).
| Demographics | Rating | Rank | Unemployment Among Women with Children Ages 6 to 17 years |
| Paiute | 99.1 /100 | #89 | Exceptional 8.5% |
| Yugoslavians | 99.0 /100 | #90 | Exceptional 8.5% |
| Immigrants | Eastern Europe | 99.0 /100 | #91 | Exceptional 8.5% |
| Potawatomi | 99.0 /100 | #92 | Exceptional 8.5% |
| Australians | 98.9 /100 | #93 | Exceptional 8.5% |
| Immigrants | Barbados | 98.8 /100 | #94 | Exceptional 8.5% |
| Sri Lankans | 98.7 /100 | #95 | Exceptional 8.5% |
| German Russians | 98.6 /100 | #96 | Exceptional 8.5% |
| Bolivians | 98.5 /100 | #97 | Exceptional 8.5% |
| Malaysians | 98.5 /100 | #98 | Exceptional 8.6% |
| Immigrants | Lithuania | 98.4 /100 | #99 | Exceptional 8.6% |
| New Zealanders | 98.4 /100 | #100 | Exceptional 8.6% |
| Immigrants | Pakistan | 98.4 /100 | #101 | Exceptional 8.6% |
| Immigrants | South Africa | 98.3 /100 | #102 | Exceptional 8.6% |
| Scandinavians | 98.3 /100 | #103 | Exceptional 8.6% |