Estonian vs Sri Lankan 3rd Grade
COMPARE
Estonian
Sri Lankan
3rd Grade
3rd Grade Comparison
Estonians
Sri Lankans
98.3%
3RD GRADE
99.8/ 100
METRIC RATING
49th/ 347
METRIC RANK
96.7%
3RD GRADE
0.0/ 100
METRIC RATING
309th/ 347
METRIC RANK
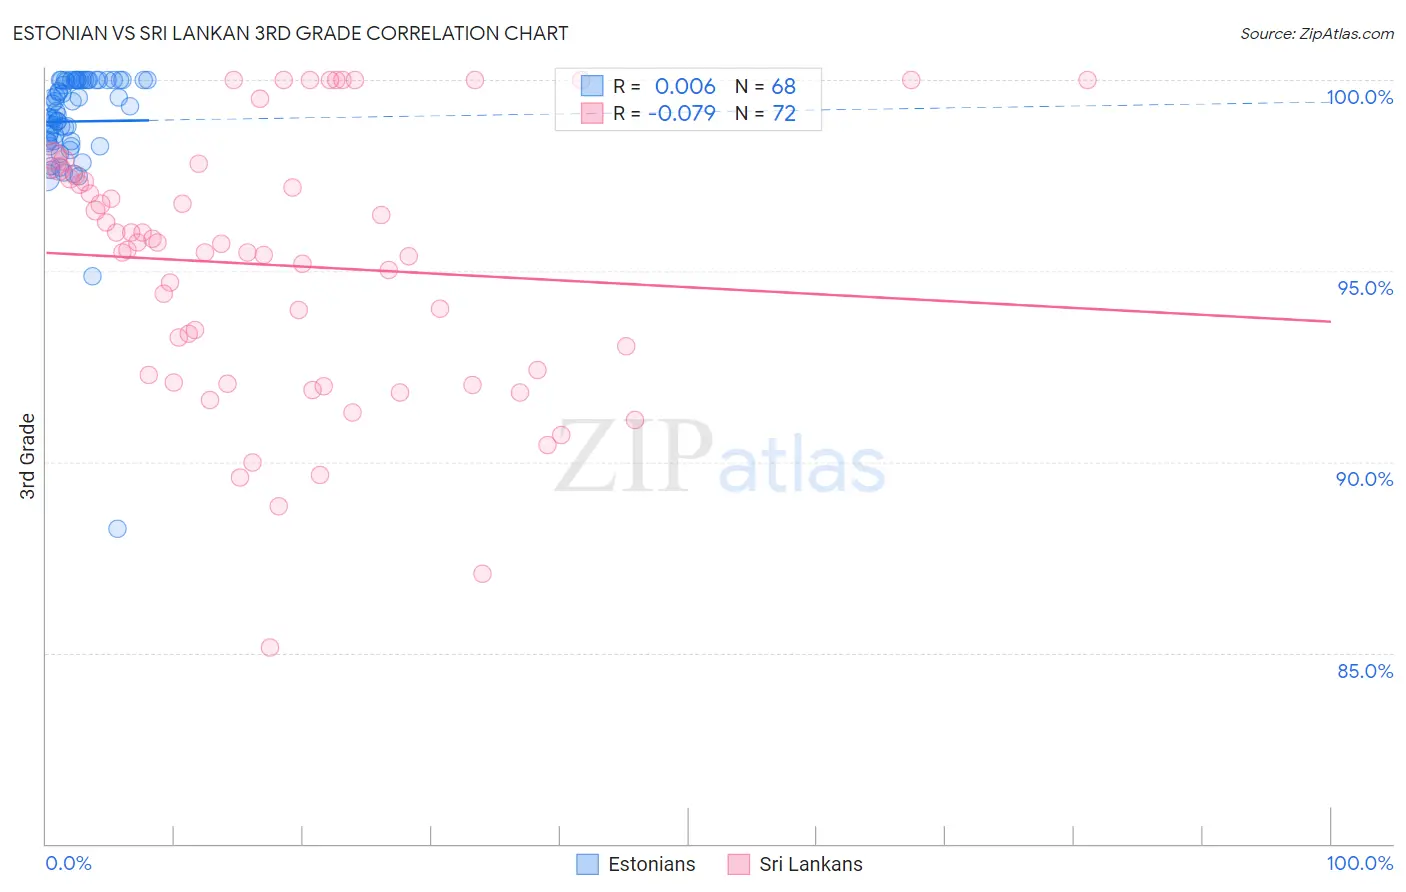
Estonian vs Sri Lankan 3rd Grade Correlation Chart
The statistical analysis conducted on geographies consisting of 123,528,404 people shows no correlation between the proportion of Estonians and percentage of population with at least 3rd grade education in the United States with a correlation coefficient (R) of 0.006 and weighted average of 98.3%. Similarly, the statistical analysis conducted on geographies consisting of 440,593,746 people shows a slight negative correlation between the proportion of Sri Lankans and percentage of population with at least 3rd grade education in the United States with a correlation coefficient (R) of -0.079 and weighted average of 96.7%, a difference of 1.7%.
3rd Grade Correlation Summary
| Measurement | Estonian | Sri Lankan |
| Minimum | 88.3% | 85.2% |
| Maximum | 100.0% | 100.0% |
| Range | 11.7% | 14.8% |
| Mean | 98.9% | 95.1% |
| Median | 99.2% | 95.6% |
| Interquartile 25% (IQ1) | 98.4% | 92.2% |
| Interquartile 75% (IQ3) | 100.0% | 97.5% |
| Interquartile Range (IQR) | 1.6% | 5.3% |
| Standard Deviation (Sample) | 1.6% | 3.4% |
| Standard Deviation (Population) | 1.6% | 3.4% |
Similar Demographics by 3rd Grade
Demographics Similar to Estonians by 3rd Grade
In terms of 3rd grade, the demographic groups most similar to Estonians are Celtic (98.3%, a difference of 0.0%), Australian (98.3%, a difference of 0.0%), White/Caucasian (98.3%, a difference of 0.0%), Lumbee (98.3%, a difference of 0.010%), and Immigrants from Scotland (98.3%, a difference of 0.010%).
| Demographics | Rating | Rank | 3rd Grade |
| Belgians | 99.9 /100 | #42 | Exceptional 98.3% |
| Northern Europeans | 99.9 /100 | #43 | Exceptional 98.3% |
| Hungarians | 99.9 /100 | #44 | Exceptional 98.3% |
| Native Hawaiians | 99.9 /100 | #45 | Exceptional 98.3% |
| Ottawa | 99.8 /100 | #46 | Exceptional 98.3% |
| Czechoslovakians | 99.8 /100 | #47 | Exceptional 98.3% |
| Lumbee | 99.8 /100 | #48 | Exceptional 98.3% |
| Estonians | 99.8 /100 | #49 | Exceptional 98.3% |
| Celtics | 99.8 /100 | #50 | Exceptional 98.3% |
| Australians | 99.8 /100 | #51 | Exceptional 98.3% |
| Whites/Caucasians | 99.8 /100 | #52 | Exceptional 98.3% |
| Immigrants | Scotland | 99.8 /100 | #53 | Exceptional 98.3% |
| Bulgarians | 99.8 /100 | #54 | Exceptional 98.3% |
| Americans | 99.8 /100 | #55 | Exceptional 98.3% |
| Austrians | 99.8 /100 | #56 | Exceptional 98.3% |
Demographics Similar to Sri Lankans by 3rd Grade
In terms of 3rd grade, the demographic groups most similar to Sri Lankans are Nicaraguan (96.7%, a difference of 0.0%), Immigrants from Haiti (96.7%, a difference of 0.0%), Guyanese (96.7%, a difference of 0.020%), Cape Verdean (96.6%, a difference of 0.030%), and Central American Indian (96.7%, a difference of 0.050%).
| Demographics | Rating | Rank | 3rd Grade |
| Immigrants | Somalia | 0.0 /100 | #302 | Tragic 96.8% |
| Ecuadorians | 0.0 /100 | #303 | Tragic 96.7% |
| Immigrants | Caribbean | 0.0 /100 | #304 | Tragic 96.7% |
| Central American Indians | 0.0 /100 | #305 | Tragic 96.7% |
| Guyanese | 0.0 /100 | #306 | Tragic 96.7% |
| Nicaraguans | 0.0 /100 | #307 | Tragic 96.7% |
| Immigrants | Haiti | 0.0 /100 | #308 | Tragic 96.7% |
| Sri Lankans | 0.0 /100 | #309 | Tragic 96.7% |
| Cape Verdeans | 0.0 /100 | #310 | Tragic 96.6% |
| Immigrants | Guyana | 0.0 /100 | #311 | Tragic 96.6% |
| Immigrants | Laos | 0.0 /100 | #312 | Tragic 96.6% |
| Immigrants | Ecuador | 0.0 /100 | #313 | Tragic 96.6% |
| Belizeans | 0.0 /100 | #314 | Tragic 96.6% |
| Immigrants | Azores | 0.0 /100 | #315 | Tragic 96.6% |
| Immigrants | Burma/Myanmar | 0.0 /100 | #316 | Tragic 96.6% |