Estonian vs Sri Lankan In Labor Force | Age 25-29
COMPARE
Estonian
Sri Lankan
In Labor Force | Age 25-29
In Labor Force | Age 25-29 Comparison
Estonians
Sri Lankans
85.5%
IN LABOR FORCE | AGE 25-29
99.6/ 100
METRIC RATING
57th/ 347
METRIC RANK
84.8%
IN LABOR FORCE | AGE 25-29
69.2/ 100
METRIC RATING
143rd/ 347
METRIC RANK
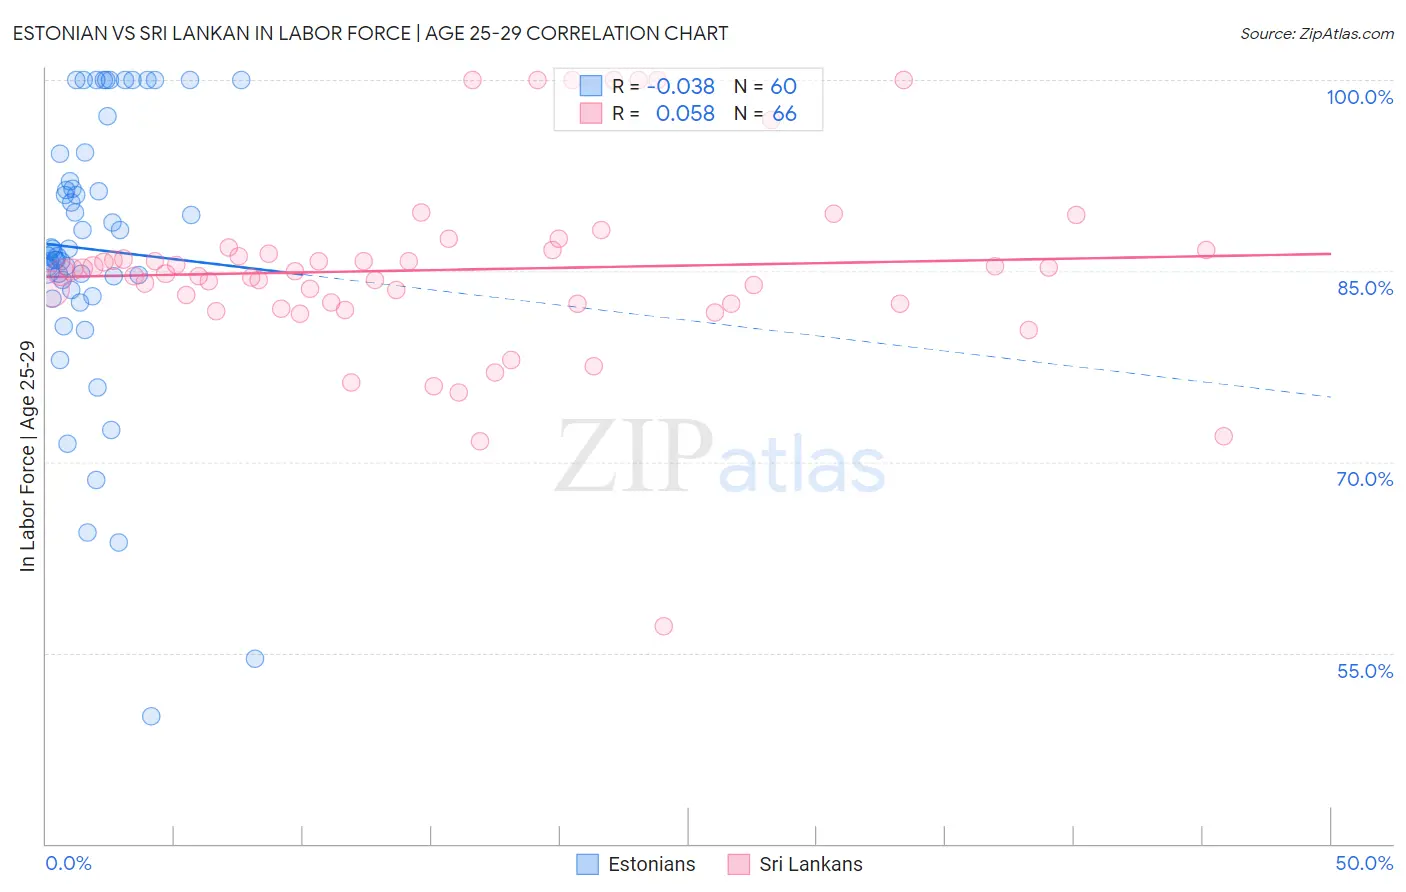
Estonian vs Sri Lankan In Labor Force | Age 25-29 Correlation Chart
The statistical analysis conducted on geographies consisting of 123,516,620 people shows no correlation between the proportion of Estonians and labor force participation rate among population between the ages 25 and 29 in the United States with a correlation coefficient (R) of -0.038 and weighted average of 85.5%. Similarly, the statistical analysis conducted on geographies consisting of 440,430,166 people shows a slight positive correlation between the proportion of Sri Lankans and labor force participation rate among population between the ages 25 and 29 in the United States with a correlation coefficient (R) of 0.058 and weighted average of 84.8%, a difference of 0.85%.
In Labor Force | Age 25-29 Correlation Summary
| Measurement | Estonian | Sri Lankan |
| Minimum | 50.0% | 57.1% |
| Maximum | 100.0% | 100.0% |
| Range | 50.0% | 42.9% |
| Mean | 86.7% | 85.1% |
| Median | 86.6% | 84.9% |
| Interquartile 25% (IQ1) | 83.9% | 82.4% |
| Interquartile 75% (IQ3) | 93.1% | 86.6% |
| Interquartile Range (IQR) | 9.2% | 4.2% |
| Standard Deviation (Sample) | 10.9% | 7.3% |
| Standard Deviation (Population) | 10.8% | 7.3% |
Similar Demographics by In Labor Force | Age 25-29
Demographics Similar to Estonians by In Labor Force | Age 25-29
In terms of in labor force | age 25-29, the demographic groups most similar to Estonians are Eastern European (85.5%, a difference of 0.010%), Greek (85.5%, a difference of 0.010%), Immigrants from Morocco (85.5%, a difference of 0.010%), Immigrants from Brazil (85.5%, a difference of 0.040%), and Thai (85.5%, a difference of 0.040%).
| Demographics | Rating | Rank | In Labor Force | Age 25-29 |
| Yugoslavians | 99.8 /100 | #50 | Exceptional 85.6% |
| Immigrants | Latvia | 99.8 /100 | #51 | Exceptional 85.6% |
| Immigrants | Poland | 99.7 /100 | #52 | Exceptional 85.6% |
| Belgians | 99.7 /100 | #53 | Exceptional 85.5% |
| Albanians | 99.7 /100 | #54 | Exceptional 85.5% |
| Immigrants | Brazil | 99.7 /100 | #55 | Exceptional 85.5% |
| Eastern Europeans | 99.6 /100 | #56 | Exceptional 85.5% |
| Estonians | 99.6 /100 | #57 | Exceptional 85.5% |
| Greeks | 99.6 /100 | #58 | Exceptional 85.5% |
| Immigrants | Morocco | 99.5 /100 | #59 | Exceptional 85.5% |
| Thais | 99.5 /100 | #60 | Exceptional 85.5% |
| Serbians | 99.5 /100 | #61 | Exceptional 85.5% |
| Taiwanese | 99.4 /100 | #62 | Exceptional 85.4% |
| Immigrants | Kenya | 99.4 /100 | #63 | Exceptional 85.4% |
| Immigrants | Italy | 99.3 /100 | #64 | Exceptional 85.4% |
Demographics Similar to Sri Lankans by In Labor Force | Age 25-29
In terms of in labor force | age 25-29, the demographic groups most similar to Sri Lankans are Immigrants from Laos (84.8%, a difference of 0.0%), Pakistani (84.8%, a difference of 0.010%), Immigrants from Senegal (84.8%, a difference of 0.010%), Icelander (84.8%, a difference of 0.010%), and Immigrants from Asia (84.8%, a difference of 0.010%).
| Demographics | Rating | Rank | In Labor Force | Age 25-29 |
| Bhutanese | 76.0 /100 | #136 | Good 84.8% |
| Immigrants | Canada | 73.5 /100 | #137 | Good 84.8% |
| Armenians | 72.7 /100 | #138 | Good 84.8% |
| Immigrants | Eastern Asia | 72.6 /100 | #139 | Good 84.8% |
| Immigrants | North America | 72.1 /100 | #140 | Good 84.8% |
| Danes | 71.9 /100 | #141 | Good 84.8% |
| Pakistanis | 70.0 /100 | #142 | Good 84.8% |
| Sri Lankans | 69.2 /100 | #143 | Good 84.8% |
| Immigrants | Laos | 69.0 /100 | #144 | Good 84.8% |
| Immigrants | Senegal | 68.3 /100 | #145 | Good 84.8% |
| Icelanders | 68.2 /100 | #146 | Good 84.8% |
| Immigrants | Asia | 68.2 /100 | #147 | Good 84.8% |
| Immigrants | England | 65.2 /100 | #148 | Good 84.7% |
| Peruvians | 64.7 /100 | #149 | Good 84.7% |
| Swiss | 64.7 /100 | #150 | Good 84.7% |