Estonian vs Cambodian In Labor Force | Age > 16
COMPARE
Estonian
Cambodian
In Labor Force | Age > 16
In Labor Force | Age > 16 Comparison
Estonians
Cambodians
64.8%
IN LABOR FORCE | AGE > 16
13.1/ 100
METRIC RATING
214th/ 347
METRIC RANK
67.4%
IN LABOR FORCE | AGE > 16
100.0/ 100
METRIC RATING
23rd/ 347
METRIC RANK
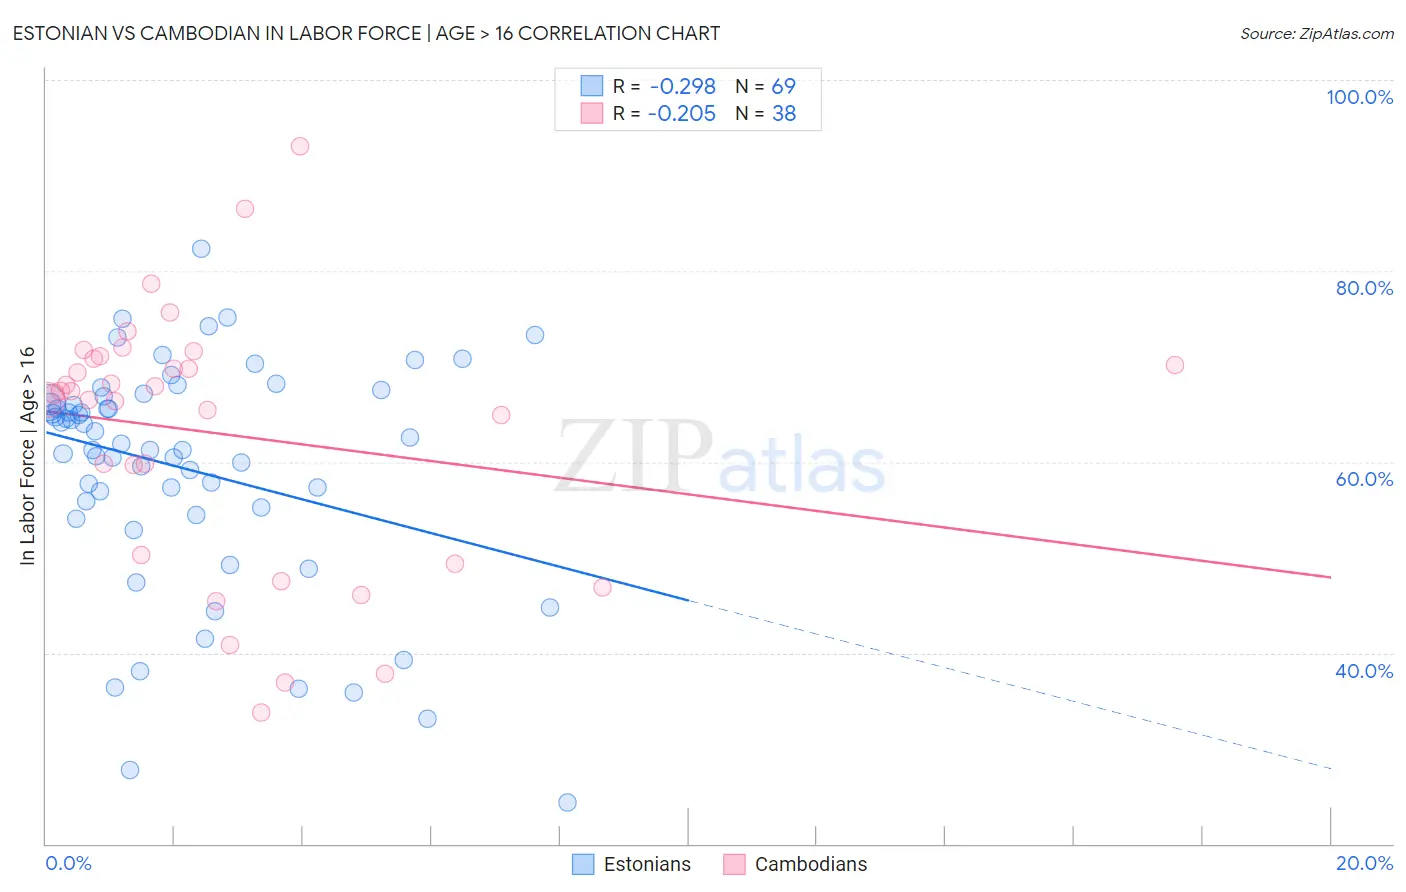
Estonian vs Cambodian In Labor Force | Age > 16 Correlation Chart
The statistical analysis conducted on geographies consisting of 123,528,478 people shows a weak negative correlation between the proportion of Estonians and labor force participation rate among population ages 16 and over in the United States with a correlation coefficient (R) of -0.298 and weighted average of 64.8%. Similarly, the statistical analysis conducted on geographies consisting of 102,521,417 people shows a weak negative correlation between the proportion of Cambodians and labor force participation rate among population ages 16 and over in the United States with a correlation coefficient (R) of -0.205 and weighted average of 67.4%, a difference of 4.1%.
In Labor Force | Age > 16 Correlation Summary
| Measurement | Estonian | Cambodian |
| Minimum | 24.3% | 33.7% |
| Maximum | 82.3% | 93.1% |
| Range | 58.0% | 59.4% |
| Mean | 59.2% | 63.0% |
| Median | 61.9% | 67.3% |
| Interquartile 25% (IQ1) | 54.8% | 50.2% |
| Interquartile 75% (IQ3) | 66.6% | 70.8% |
| Interquartile Range (IQR) | 11.7% | 20.6% |
| Standard Deviation (Sample) | 12.0% | 13.6% |
| Standard Deviation (Population) | 11.9% | 13.4% |
Similar Demographics by In Labor Force | Age > 16
Demographics Similar to Estonians by In Labor Force | Age > 16
In terms of in labor force | age > 16, the demographic groups most similar to Estonians are Fijian (64.8%, a difference of 0.020%), Alaskan Athabascan (64.8%, a difference of 0.020%), Maltese (64.8%, a difference of 0.020%), Immigrants from Czechoslovakia (64.8%, a difference of 0.020%), and Immigrants from Denmark (64.8%, a difference of 0.040%).
| Demographics | Rating | Rank | In Labor Force | Age > 16 |
| Immigrants | Latin America | 16.4 /100 | #207 | Poor 64.8% |
| Belizeans | 16.2 /100 | #208 | Poor 64.8% |
| Immigrants | Trinidad and Tobago | 15.6 /100 | #209 | Poor 64.8% |
| Immigrants | Denmark | 14.7 /100 | #210 | Poor 64.8% |
| Fijians | 14.1 /100 | #211 | Poor 64.8% |
| Alaskan Athabascans | 13.9 /100 | #212 | Poor 64.8% |
| Maltese | 13.8 /100 | #213 | Poor 64.8% |
| Estonians | 13.1 /100 | #214 | Poor 64.8% |
| Immigrants | Czechoslovakia | 12.3 /100 | #215 | Poor 64.8% |
| Belgians | 11.4 /100 | #216 | Poor 64.7% |
| U.S. Virgin Islanders | 11.3 /100 | #217 | Poor 64.7% |
| Alsatians | 10.7 /100 | #218 | Poor 64.7% |
| Immigrants | Central America | 10.5 /100 | #219 | Poor 64.7% |
| Alaska Natives | 9.9 /100 | #220 | Tragic 64.7% |
| Immigrants | Micronesia | 9.6 /100 | #221 | Tragic 64.7% |
Demographics Similar to Cambodians by In Labor Force | Age > 16
In terms of in labor force | age > 16, the demographic groups most similar to Cambodians are Ugandan (67.4%, a difference of 0.060%), Immigrants from Africa (67.4%, a difference of 0.090%), Immigrants from Uganda (67.5%, a difference of 0.12%), Immigrants from Cabo Verde (67.3%, a difference of 0.12%), and Tongan (67.5%, a difference of 0.18%).
| Demographics | Rating | Rank | In Labor Force | Age > 16 |
| Immigrants | Sudan | 100.0 /100 | #16 | Exceptional 67.7% |
| Immigrants | India | 100.0 /100 | #17 | Exceptional 67.6% |
| Immigrants | Liberia | 100.0 /100 | #18 | Exceptional 67.6% |
| Kenyans | 100.0 /100 | #19 | Exceptional 67.6% |
| Immigrants | Kenya | 100.0 /100 | #20 | Exceptional 67.6% |
| Tongans | 100.0 /100 | #21 | Exceptional 67.5% |
| Immigrants | Uganda | 100.0 /100 | #22 | Exceptional 67.5% |
| Cambodians | 100.0 /100 | #23 | Exceptional 67.4% |
| Ugandans | 100.0 /100 | #24 | Exceptional 67.4% |
| Immigrants | Africa | 100.0 /100 | #25 | Exceptional 67.4% |
| Immigrants | Cabo Verde | 100.0 /100 | #26 | Exceptional 67.3% |
| Zimbabweans | 100.0 /100 | #27 | Exceptional 67.3% |
| Immigrants | Morocco | 100.0 /100 | #28 | Exceptional 67.2% |
| Thais | 100.0 /100 | #29 | Exceptional 67.2% |
| Immigrants | Zaire | 100.0 /100 | #30 | Exceptional 67.2% |