Egyptian vs Immigrants from North America Male Unemployment
COMPARE
Egyptian
Immigrants from North America
Male Unemployment
Male Unemployment Comparison
Egyptians
Immigrants from North America
5.2%
MALE UNEMPLOYMENT
74.8/ 100
METRIC RATING
152nd/ 347
METRIC RANK
5.0%
MALE UNEMPLOYMENT
96.9/ 100
METRIC RATING
74th/ 347
METRIC RANK
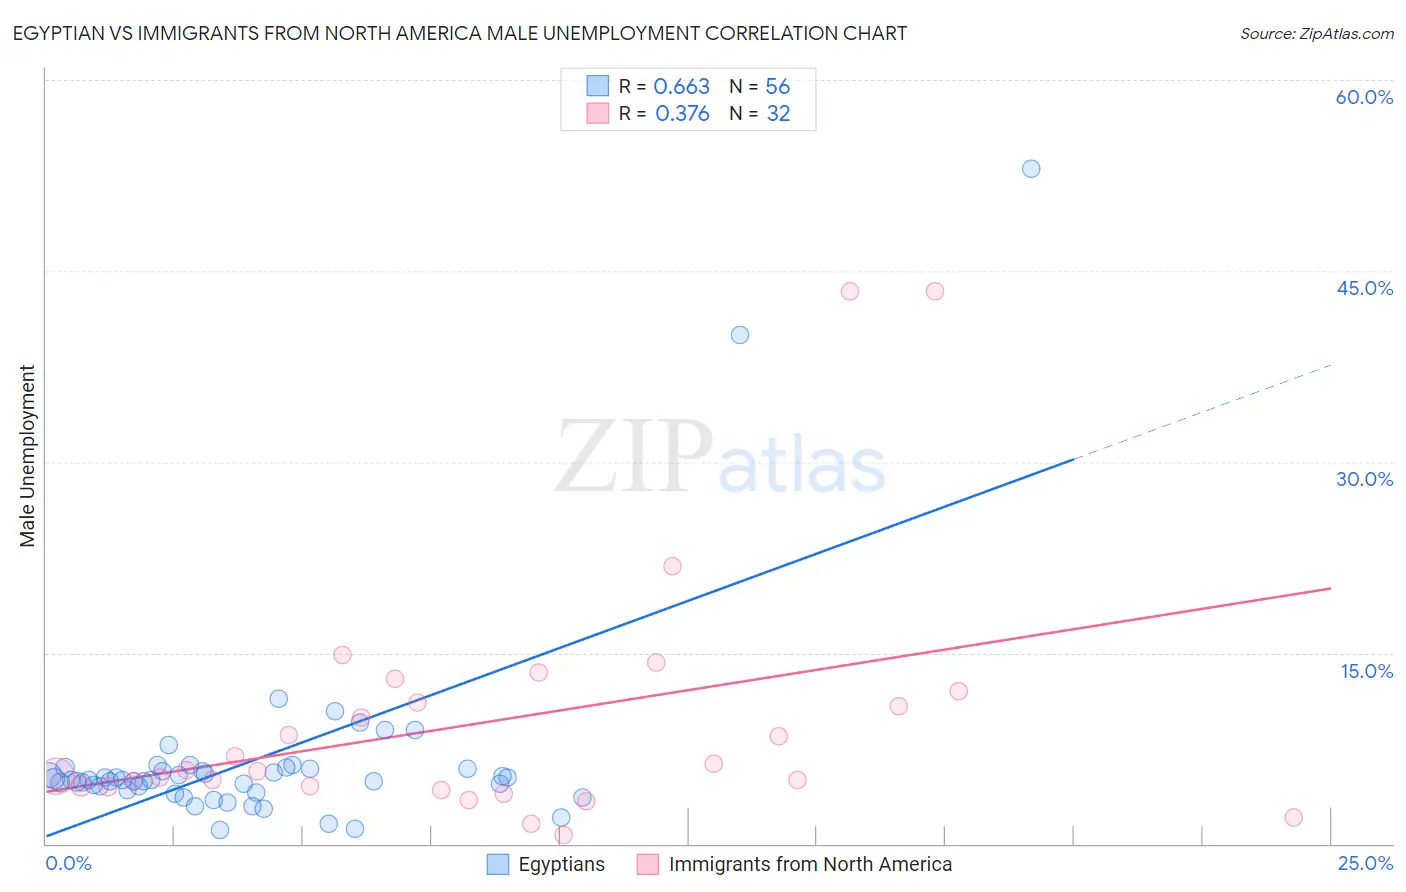
Egyptian vs Immigrants from North America Male Unemployment Correlation Chart
The statistical analysis conducted on geographies consisting of 276,492,252 people shows a significant positive correlation between the proportion of Egyptians and unemployment rate among males in the United States with a correlation coefficient (R) of 0.663 and weighted average of 5.2%. Similarly, the statistical analysis conducted on geographies consisting of 459,389,542 people shows a mild positive correlation between the proportion of Immigrants from North America and unemployment rate among males in the United States with a correlation coefficient (R) of 0.376 and weighted average of 5.0%, a difference of 3.6%.
Male Unemployment Correlation Summary
| Measurement | Egyptian | Immigrants from North America |
| Minimum | 1.1% | 0.66% |
| Maximum | 53.0% | 43.4% |
| Range | 51.9% | 42.7% |
| Mean | 6.6% | 9.6% |
| Median | 5.0% | 5.8% |
| Interquartile 25% (IQ1) | 4.4% | 4.5% |
| Interquartile 75% (IQ3) | 5.9% | 11.5% |
| Interquartile Range (IQR) | 1.5% | 7.0% |
| Standard Deviation (Sample) | 8.1% | 10.0% |
| Standard Deviation (Population) | 8.0% | 9.8% |
Similar Demographics by Male Unemployment
Demographics Similar to Egyptians by Male Unemployment
In terms of male unemployment, the demographic groups most similar to Egyptians are Slovak (5.2%, a difference of 0.050%), Immigrants from Uruguay (5.2%, a difference of 0.070%), Laotian (5.2%, a difference of 0.080%), Indian (Asian) (5.2%, a difference of 0.090%), and Immigrants from Europe (5.2%, a difference of 0.11%).
| Demographics | Rating | Rank | Male Unemployment |
| Macedonians | 77.7 /100 | #145 | Good 5.2% |
| Immigrants | Kenya | 77.6 /100 | #146 | Good 5.2% |
| Immigrants | Burma/Myanmar | 77.5 /100 | #147 | Good 5.2% |
| Immigrants | Italy | 76.3 /100 | #148 | Good 5.2% |
| Immigrants | Europe | 76.2 /100 | #149 | Good 5.2% |
| Indians (Asian) | 76.0 /100 | #150 | Good 5.2% |
| Slovaks | 75.5 /100 | #151 | Good 5.2% |
| Egyptians | 74.8 /100 | #152 | Good 5.2% |
| Immigrants | Uruguay | 73.9 /100 | #153 | Good 5.2% |
| Laotians | 73.8 /100 | #154 | Good 5.2% |
| Immigrants | Hungary | 73.4 /100 | #155 | Good 5.2% |
| Americans | 72.7 /100 | #156 | Good 5.2% |
| Immigrants | Northern Africa | 72.3 /100 | #157 | Good 5.2% |
| Immigrants | Indonesia | 71.5 /100 | #158 | Good 5.2% |
| Indonesians | 71.2 /100 | #159 | Good 5.2% |
Demographics Similar to Immigrants from North America by Male Unemployment
In terms of male unemployment, the demographic groups most similar to Immigrants from North America are Greek (5.0%, a difference of 0.030%), Assyrian/Chaldean/Syriac (5.0%, a difference of 0.030%), Immigrants from South Africa (5.0%, a difference of 0.11%), New Zealander (5.0%, a difference of 0.19%), and Immigrants from Sudan (5.0%, a difference of 0.19%).
| Demographics | Rating | Rank | Male Unemployment |
| Immigrants | Canada | 97.5 /100 | #67 | Exceptional 5.0% |
| Australians | 97.4 /100 | #68 | Exceptional 5.0% |
| Immigrants | Sweden | 97.4 /100 | #69 | Exceptional 5.0% |
| Whites/Caucasians | 97.3 /100 | #70 | Exceptional 5.0% |
| New Zealanders | 97.3 /100 | #71 | Exceptional 5.0% |
| Immigrants | South Africa | 97.1 /100 | #72 | Exceptional 5.0% |
| Greeks | 97.0 /100 | #73 | Exceptional 5.0% |
| Immigrants | North America | 96.9 /100 | #74 | Exceptional 5.0% |
| Assyrians/Chaldeans/Syriacs | 96.9 /100 | #75 | Exceptional 5.0% |
| Immigrants | Sudan | 96.5 /100 | #76 | Exceptional 5.0% |
| Iranians | 96.4 /100 | #77 | Exceptional 5.0% |
| Immigrants | Northern Europe | 96.4 /100 | #78 | Exceptional 5.0% |
| South Africans | 96.4 /100 | #79 | Exceptional 5.0% |
| Argentineans | 96.2 /100 | #80 | Exceptional 5.0% |
| French | 96.2 /100 | #81 | Exceptional 5.0% |