Dutch West Indian vs Nigerian Unemployment Among Ages 20 to 24 years
COMPARE
Dutch West Indian
Nigerian
Unemployment Among Ages 20 to 24 years
Unemployment Among Ages 20 to 24 years Comparison
Dutch West Indians
Nigerians
10.9%
UNEMPLOYMENT AMONG AGES 20 TO 24 YEARS
0.3/ 100
METRIC RATING
258th/ 347
METRIC RANK
11.4%
UNEMPLOYMENT AMONG AGES 20 TO 24 YEARS
0.0/ 100
METRIC RATING
272nd/ 347
METRIC RANK
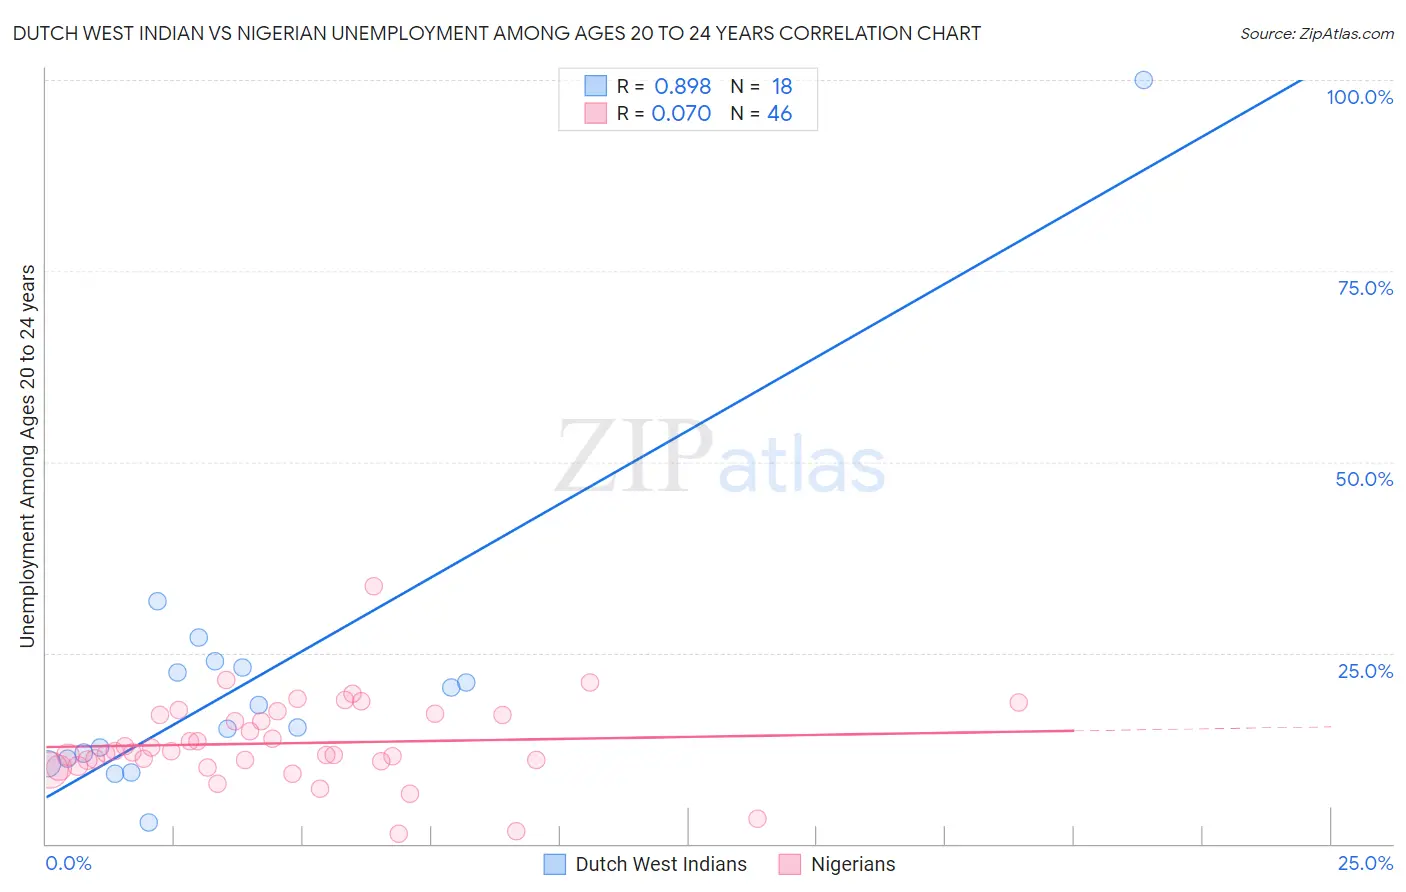
Dutch West Indian vs Nigerian Unemployment Among Ages 20 to 24 years Correlation Chart
The statistical analysis conducted on geographies consisting of 83,977,939 people shows a very strong positive correlation between the proportion of Dutch West Indians and unemployment rate among population between the ages 20 and 24 in the United States with a correlation coefficient (R) of 0.898 and weighted average of 10.9%. Similarly, the statistical analysis conducted on geographies consisting of 327,356,401 people shows a slight positive correlation between the proportion of Nigerians and unemployment rate among population between the ages 20 and 24 in the United States with a correlation coefficient (R) of 0.070 and weighted average of 11.4%, a difference of 5.0%.
Unemployment Among Ages 20 to 24 years Correlation Summary
| Measurement | Dutch West Indian | Nigerian |
| Minimum | 2.8% | 1.3% |
| Maximum | 100.0% | 33.7% |
| Range | 97.2% | 32.4% |
| Mean | 21.4% | 13.2% |
| Median | 16.7% | 12.0% |
| Interquartile 25% (IQ1) | 11.2% | 10.7% |
| Interquartile 75% (IQ3) | 23.1% | 16.9% |
| Interquartile Range (IQR) | 11.9% | 6.1% |
| Standard Deviation (Sample) | 20.9% | 5.6% |
| Standard Deviation (Population) | 20.3% | 5.5% |
Demographics Similar to Dutch West Indians and Nigerians by Unemployment Among Ages 20 to 24 years
In terms of unemployment among ages 20 to 24 years, the demographic groups most similar to Dutch West Indians are Immigrants from Western Asia (10.9%, a difference of 0.070%), Panamanian (10.9%, a difference of 0.10%), Immigrants from Lebanon (10.9%, a difference of 0.13%), Immigrants from Bahamas (10.9%, a difference of 0.14%), and Immigrants from Israel (10.8%, a difference of 0.24%). Similarly, the demographic groups most similar to Nigerians are Immigrants from Uzbekistan (11.4%, a difference of 0.030%), Immigrants from Nigeria (11.5%, a difference of 0.61%), Cape Verdean (11.5%, a difference of 0.69%), Senegalese (11.5%, a difference of 1.1%), and Delaware (11.3%, a difference of 1.1%).
| Demographics | Rating | Rank | Unemployment Among Ages 20 to 24 years |
| Immigrants | Israel | 0.3 /100 | #255 | Tragic 10.8% |
| Immigrants | Bahamas | 0.3 /100 | #256 | Tragic 10.9% |
| Immigrants | Western Asia | 0.3 /100 | #257 | Tragic 10.9% |
| Dutch West Indians | 0.3 /100 | #258 | Tragic 10.9% |
| Panamanians | 0.2 /100 | #259 | Tragic 10.9% |
| Immigrants | Lebanon | 0.2 /100 | #260 | Tragic 10.9% |
| Puget Sound Salish | 0.2 /100 | #261 | Tragic 10.9% |
| Immigrants | Latin America | 0.1 /100 | #262 | Tragic 11.0% |
| Marshallese | 0.1 /100 | #263 | Tragic 11.0% |
| Sub-Saharan Africans | 0.0 /100 | #264 | Tragic 11.1% |
| Immigrants | Ireland | 0.0 /100 | #265 | Tragic 11.1% |
| Immigrants | Liberia | 0.0 /100 | #266 | Tragic 11.1% |
| Immigrants | Greece | 0.0 /100 | #267 | Tragic 11.1% |
| Maltese | 0.0 /100 | #268 | Tragic 11.2% |
| Ute | 0.0 /100 | #269 | Tragic 11.2% |
| Delaware | 0.0 /100 | #270 | Tragic 11.3% |
| Immigrants | Uzbekistan | 0.0 /100 | #271 | Tragic 11.4% |
| Nigerians | 0.0 /100 | #272 | Tragic 11.4% |
| Immigrants | Nigeria | 0.0 /100 | #273 | Tragic 11.5% |
| Cape Verdeans | 0.0 /100 | #274 | Tragic 11.5% |
| Senegalese | 0.0 /100 | #275 | Tragic 11.5% |