Dutch West Indian vs German Russian Unemployment Among Ages 20 to 24 years
COMPARE
Dutch West Indian
German Russian
Unemployment Among Ages 20 to 24 years
Unemployment Among Ages 20 to 24 years Comparison
Dutch West Indians
German Russians
10.9%
UNEMPLOYMENT AMONG AGES 20 TO 24 YEARS
0.3/ 100
METRIC RATING
258th/ 347
METRIC RANK
10.1%
UNEMPLOYMENT AMONG AGES 20 TO 24 YEARS
92.4/ 100
METRIC RATING
113th/ 347
METRIC RANK
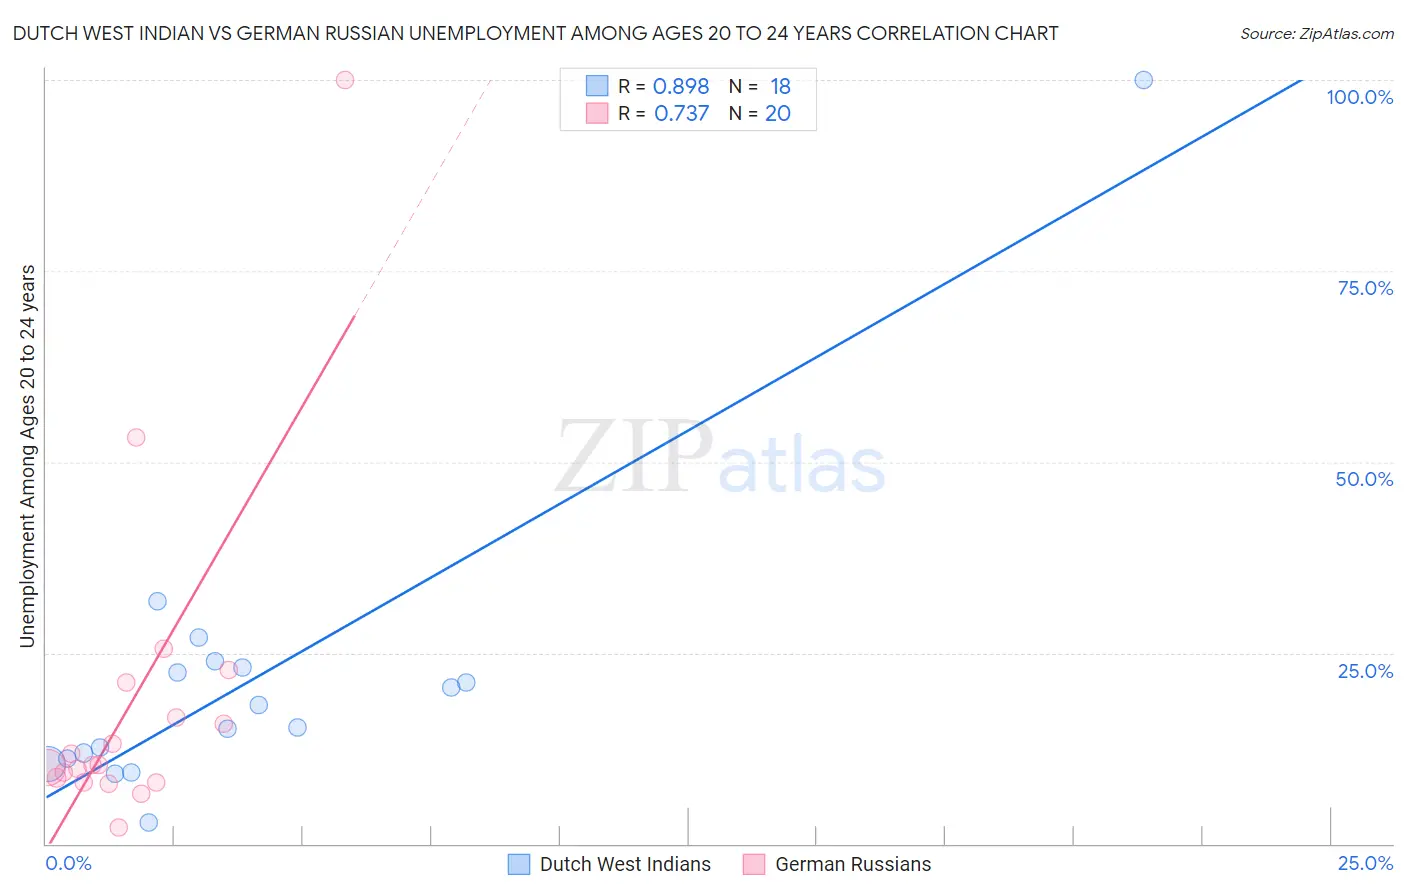
Dutch West Indian vs German Russian Unemployment Among Ages 20 to 24 years Correlation Chart
The statistical analysis conducted on geographies consisting of 83,977,939 people shows a very strong positive correlation between the proportion of Dutch West Indians and unemployment rate among population between the ages 20 and 24 in the United States with a correlation coefficient (R) of 0.898 and weighted average of 10.9%. Similarly, the statistical analysis conducted on geographies consisting of 95,272,283 people shows a strong positive correlation between the proportion of German Russians and unemployment rate among population between the ages 20 and 24 in the United States with a correlation coefficient (R) of 0.737 and weighted average of 10.1%, a difference of 7.9%.
Unemployment Among Ages 20 to 24 years Correlation Summary
| Measurement | Dutch West Indian | German Russian |
| Minimum | 2.8% | 2.1% |
| Maximum | 100.0% | 100.0% |
| Range | 97.2% | 97.9% |
| Mean | 21.4% | 18.5% |
| Median | 16.7% | 10.3% |
| Interquartile 25% (IQ1) | 11.2% | 8.3% |
| Interquartile 75% (IQ3) | 23.1% | 18.8% |
| Interquartile Range (IQR) | 11.9% | 10.5% |
| Standard Deviation (Sample) | 20.9% | 22.0% |
| Standard Deviation (Population) | 20.3% | 21.5% |
Similar Demographics by Unemployment Among Ages 20 to 24 years
Demographics Similar to Dutch West Indians by Unemployment Among Ages 20 to 24 years
In terms of unemployment among ages 20 to 24 years, the demographic groups most similar to Dutch West Indians are Immigrants from Western Asia (10.9%, a difference of 0.070%), Panamanian (10.9%, a difference of 0.10%), Immigrants from Lebanon (10.9%, a difference of 0.13%), Immigrants from Bahamas (10.9%, a difference of 0.14%), and Liberian (10.8%, a difference of 0.24%).
| Demographics | Rating | Rank | Unemployment Among Ages 20 to 24 years |
| Immigrants | Panama | 0.4 /100 | #251 | Tragic 10.8% |
| Immigrants | Syria | 0.4 /100 | #252 | Tragic 10.8% |
| Spanish Americans | 0.4 /100 | #253 | Tragic 10.8% |
| Liberians | 0.3 /100 | #254 | Tragic 10.8% |
| Immigrants | Israel | 0.3 /100 | #255 | Tragic 10.8% |
| Immigrants | Bahamas | 0.3 /100 | #256 | Tragic 10.9% |
| Immigrants | Western Asia | 0.3 /100 | #257 | Tragic 10.9% |
| Dutch West Indians | 0.3 /100 | #258 | Tragic 10.9% |
| Panamanians | 0.2 /100 | #259 | Tragic 10.9% |
| Immigrants | Lebanon | 0.2 /100 | #260 | Tragic 10.9% |
| Puget Sound Salish | 0.2 /100 | #261 | Tragic 10.9% |
| Immigrants | Latin America | 0.1 /100 | #262 | Tragic 11.0% |
| Marshallese | 0.1 /100 | #263 | Tragic 11.0% |
| Sub-Saharan Africans | 0.0 /100 | #264 | Tragic 11.1% |
| Immigrants | Ireland | 0.0 /100 | #265 | Tragic 11.1% |
Demographics Similar to German Russians by Unemployment Among Ages 20 to 24 years
In terms of unemployment among ages 20 to 24 years, the demographic groups most similar to German Russians are Northern European (10.1%, a difference of 0.030%), Immigrants from Indonesia (10.1%, a difference of 0.040%), Immigrants from Spain (10.1%, a difference of 0.10%), Immigrants from Latvia (10.1%, a difference of 0.11%), and Filipino (10.1%, a difference of 0.11%).
| Demographics | Rating | Rank | Unemployment Among Ages 20 to 24 years |
| Pennsylvania Germans | 93.9 /100 | #106 | Exceptional 10.0% |
| Iroquois | 93.4 /100 | #107 | Exceptional 10.1% |
| Immigrants | Latvia | 93.2 /100 | #108 | Exceptional 10.1% |
| Filipinos | 93.2 /100 | #109 | Exceptional 10.1% |
| Immigrants | Spain | 93.1 /100 | #110 | Exceptional 10.1% |
| Immigrants | Indonesia | 92.7 /100 | #111 | Exceptional 10.1% |
| Northern Europeans | 92.7 /100 | #112 | Exceptional 10.1% |
| German Russians | 92.4 /100 | #113 | Exceptional 10.1% |
| Ottawa | 90.8 /100 | #114 | Exceptional 10.1% |
| Immigrants | Morocco | 90.5 /100 | #115 | Exceptional 10.1% |
| Basques | 89.8 /100 | #116 | Excellent 10.1% |
| Immigrants | Uruguay | 89.6 /100 | #117 | Excellent 10.1% |
| Paraguayans | 88.6 /100 | #118 | Excellent 10.1% |
| French | 88.2 /100 | #119 | Excellent 10.1% |
| Immigrants | Canada | 88.2 /100 | #120 | Excellent 10.1% |