Dutch West Indian vs Immigrants from Greece Unemployment Among Ages 20 to 24 years
COMPARE
Dutch West Indian
Immigrants from Greece
Unemployment Among Ages 20 to 24 years
Unemployment Among Ages 20 to 24 years Comparison
Dutch West Indians
Immigrants from Greece
10.9%
UNEMPLOYMENT AMONG AGES 20 TO 24 YEARS
0.3/ 100
METRIC RATING
258th/ 347
METRIC RANK
11.1%
UNEMPLOYMENT AMONG AGES 20 TO 24 YEARS
0.0/ 100
METRIC RATING
267th/ 347
METRIC RANK
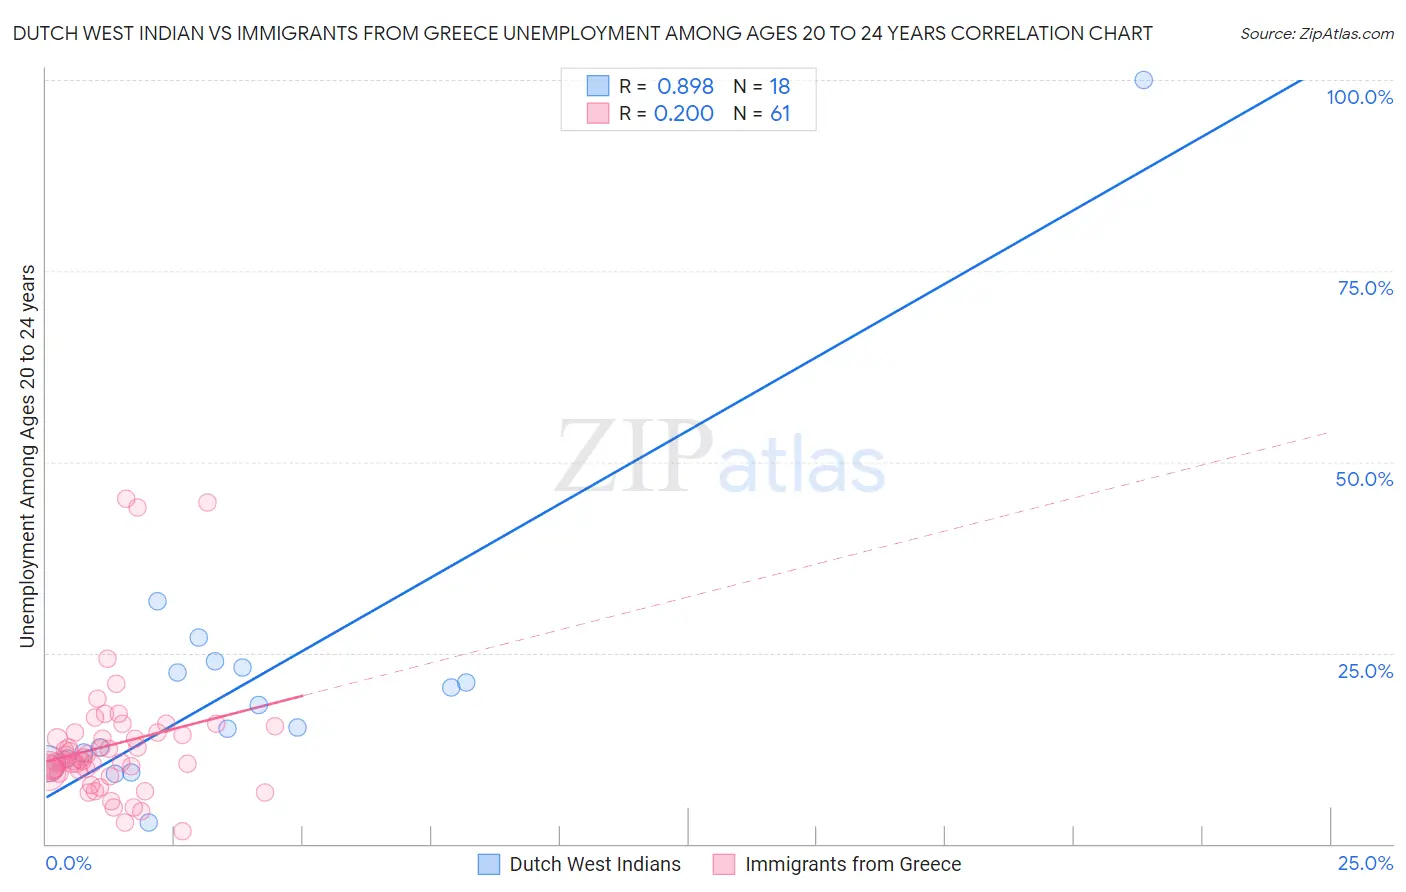
Dutch West Indian vs Immigrants from Greece Unemployment Among Ages 20 to 24 years Correlation Chart
The statistical analysis conducted on geographies consisting of 83,977,939 people shows a very strong positive correlation between the proportion of Dutch West Indians and unemployment rate among population between the ages 20 and 24 in the United States with a correlation coefficient (R) of 0.898 and weighted average of 10.9%. Similarly, the statistical analysis conducted on geographies consisting of 212,977,174 people shows a weak positive correlation between the proportion of Immigrants from Greece and unemployment rate among population between the ages 20 and 24 in the United States with a correlation coefficient (R) of 0.200 and weighted average of 11.1%, a difference of 2.3%.
Unemployment Among Ages 20 to 24 years Correlation Summary
| Measurement | Dutch West Indian | Immigrants from Greece |
| Minimum | 2.8% | 1.6% |
| Maximum | 100.0% | 45.3% |
| Range | 97.2% | 43.7% |
| Mean | 21.4% | 12.9% |
| Median | 16.7% | 10.8% |
| Interquartile 25% (IQ1) | 11.2% | 9.5% |
| Interquartile 75% (IQ3) | 23.1% | 14.3% |
| Interquartile Range (IQR) | 11.9% | 4.9% |
| Standard Deviation (Sample) | 20.9% | 8.4% |
| Standard Deviation (Population) | 20.3% | 8.3% |
Demographics Similar to Dutch West Indians and Immigrants from Greece by Unemployment Among Ages 20 to 24 years
In terms of unemployment among ages 20 to 24 years, the demographic groups most similar to Dutch West Indians are Immigrants from Western Asia (10.9%, a difference of 0.070%), Panamanian (10.9%, a difference of 0.10%), Immigrants from Lebanon (10.9%, a difference of 0.13%), Immigrants from Bahamas (10.9%, a difference of 0.14%), and Liberian (10.8%, a difference of 0.24%). Similarly, the demographic groups most similar to Immigrants from Greece are Immigrants from Liberia (11.1%, a difference of 0.28%), Immigrants from Ireland (11.1%, a difference of 0.37%), Subsaharan African (11.1%, a difference of 0.44%), Maltese (11.2%, a difference of 0.44%), and Ute (11.2%, a difference of 0.83%).
| Demographics | Rating | Rank | Unemployment Among Ages 20 to 24 years |
| Immigrants | Syria | 0.4 /100 | #252 | Tragic 10.8% |
| Spanish Americans | 0.4 /100 | #253 | Tragic 10.8% |
| Liberians | 0.3 /100 | #254 | Tragic 10.8% |
| Immigrants | Israel | 0.3 /100 | #255 | Tragic 10.8% |
| Immigrants | Bahamas | 0.3 /100 | #256 | Tragic 10.9% |
| Immigrants | Western Asia | 0.3 /100 | #257 | Tragic 10.9% |
| Dutch West Indians | 0.3 /100 | #258 | Tragic 10.9% |
| Panamanians | 0.2 /100 | #259 | Tragic 10.9% |
| Immigrants | Lebanon | 0.2 /100 | #260 | Tragic 10.9% |
| Puget Sound Salish | 0.2 /100 | #261 | Tragic 10.9% |
| Immigrants | Latin America | 0.1 /100 | #262 | Tragic 11.0% |
| Marshallese | 0.1 /100 | #263 | Tragic 11.0% |
| Sub-Saharan Africans | 0.0 /100 | #264 | Tragic 11.1% |
| Immigrants | Ireland | 0.0 /100 | #265 | Tragic 11.1% |
| Immigrants | Liberia | 0.0 /100 | #266 | Tragic 11.1% |
| Immigrants | Greece | 0.0 /100 | #267 | Tragic 11.1% |
| Maltese | 0.0 /100 | #268 | Tragic 11.2% |
| Ute | 0.0 /100 | #269 | Tragic 11.2% |
| Delaware | 0.0 /100 | #270 | Tragic 11.3% |
| Immigrants | Uzbekistan | 0.0 /100 | #271 | Tragic 11.4% |
| Nigerians | 0.0 /100 | #272 | Tragic 11.4% |