German Russian vs Soviet Union Unemployment Among Ages 20 to 24 years
COMPARE
German Russian
Soviet Union
Unemployment Among Ages 20 to 24 years
Unemployment Among Ages 20 to 24 years Comparison
German Russians
Soviet Union
10.1%
UNEMPLOYMENT AMONG AGES 20 TO 24 YEARS
92.4/ 100
METRIC RATING
113th/ 347
METRIC RANK
11.7%
UNEMPLOYMENT AMONG AGES 20 TO 24 YEARS
0.0/ 100
METRIC RATING
285th/ 347
METRIC RANK
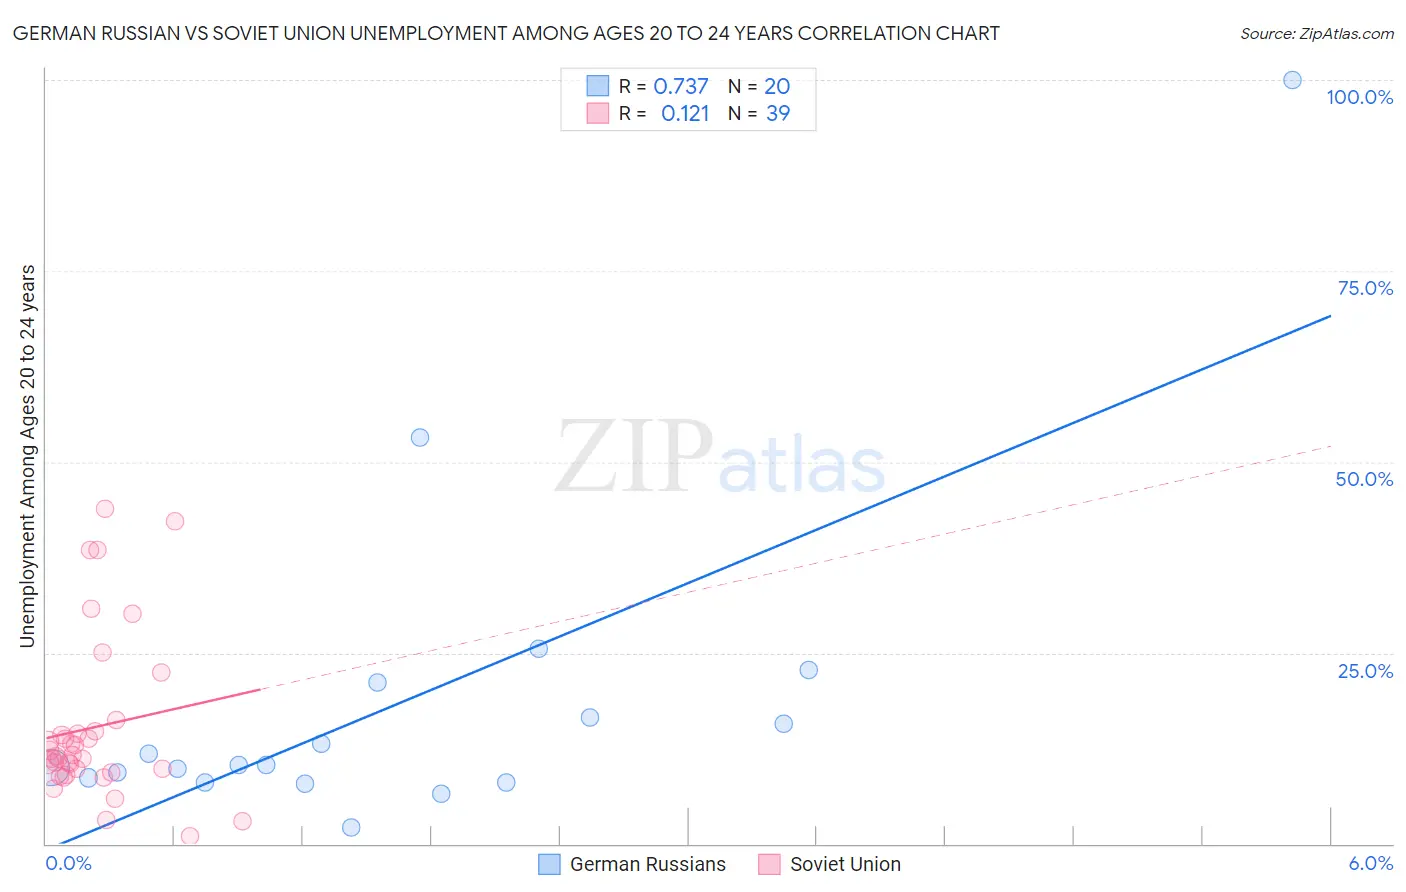
German Russian vs Soviet Union Unemployment Among Ages 20 to 24 years Correlation Chart
The statistical analysis conducted on geographies consisting of 95,272,283 people shows a strong positive correlation between the proportion of German Russians and unemployment rate among population between the ages 20 and 24 in the United States with a correlation coefficient (R) of 0.737 and weighted average of 10.1%. Similarly, the statistical analysis conducted on geographies consisting of 43,419,259 people shows a poor positive correlation between the proportion of Soviet Union and unemployment rate among population between the ages 20 and 24 in the United States with a correlation coefficient (R) of 0.121 and weighted average of 11.7%, a difference of 16.6%.
Unemployment Among Ages 20 to 24 years Correlation Summary
| Measurement | German Russian | Soviet Union |
| Minimum | 2.1% | 1.0% |
| Maximum | 100.0% | 43.8% |
| Range | 97.9% | 42.8% |
| Mean | 18.5% | 15.2% |
| Median | 10.3% | 11.4% |
| Interquartile 25% (IQ1) | 8.3% | 9.3% |
| Interquartile 75% (IQ3) | 18.8% | 14.7% |
| Interquartile Range (IQR) | 10.5% | 5.4% |
| Standard Deviation (Sample) | 22.0% | 10.7% |
| Standard Deviation (Population) | 21.5% | 10.6% |
Similar Demographics by Unemployment Among Ages 20 to 24 years
Demographics Similar to German Russians by Unemployment Among Ages 20 to 24 years
In terms of unemployment among ages 20 to 24 years, the demographic groups most similar to German Russians are Northern European (10.1%, a difference of 0.030%), Immigrants from Indonesia (10.1%, a difference of 0.040%), Immigrants from Spain (10.1%, a difference of 0.10%), Immigrants from Latvia (10.1%, a difference of 0.11%), and Filipino (10.1%, a difference of 0.11%).
| Demographics | Rating | Rank | Unemployment Among Ages 20 to 24 years |
| Pennsylvania Germans | 93.9 /100 | #106 | Exceptional 10.0% |
| Iroquois | 93.4 /100 | #107 | Exceptional 10.1% |
| Immigrants | Latvia | 93.2 /100 | #108 | Exceptional 10.1% |
| Filipinos | 93.2 /100 | #109 | Exceptional 10.1% |
| Immigrants | Spain | 93.1 /100 | #110 | Exceptional 10.1% |
| Immigrants | Indonesia | 92.7 /100 | #111 | Exceptional 10.1% |
| Northern Europeans | 92.7 /100 | #112 | Exceptional 10.1% |
| German Russians | 92.4 /100 | #113 | Exceptional 10.1% |
| Ottawa | 90.8 /100 | #114 | Exceptional 10.1% |
| Immigrants | Morocco | 90.5 /100 | #115 | Exceptional 10.1% |
| Basques | 89.8 /100 | #116 | Excellent 10.1% |
| Immigrants | Uruguay | 89.6 /100 | #117 | Excellent 10.1% |
| Paraguayans | 88.6 /100 | #118 | Excellent 10.1% |
| French | 88.2 /100 | #119 | Excellent 10.1% |
| Immigrants | Canada | 88.2 /100 | #120 | Excellent 10.1% |
Demographics Similar to Soviet Union by Unemployment Among Ages 20 to 24 years
In terms of unemployment among ages 20 to 24 years, the demographic groups most similar to Soviet Union are Immigrants from Western Africa (11.7%, a difference of 0.040%), Ghanaian (11.7%, a difference of 0.050%), Ecuadorian (11.8%, a difference of 0.12%), Immigrants from Ecuador (11.8%, a difference of 0.21%), and U.S. Virgin Islander (11.8%, a difference of 0.27%).
| Demographics | Rating | Rank | Unemployment Among Ages 20 to 24 years |
| Colville | 0.0 /100 | #278 | Tragic 11.6% |
| Bahamians | 0.0 /100 | #279 | Tragic 11.6% |
| Alaskan Athabascans | 0.0 /100 | #280 | Tragic 11.6% |
| Armenians | 0.0 /100 | #281 | Tragic 11.7% |
| Immigrants | Cameroon | 0.0 /100 | #282 | Tragic 11.7% |
| Ghanaians | 0.0 /100 | #283 | Tragic 11.7% |
| Immigrants | Western Africa | 0.0 /100 | #284 | Tragic 11.7% |
| Soviet Union | 0.0 /100 | #285 | Tragic 11.7% |
| Ecuadorians | 0.0 /100 | #286 | Tragic 11.8% |
| Immigrants | Ecuador | 0.0 /100 | #287 | Tragic 11.8% |
| U.S. Virgin Islanders | 0.0 /100 | #288 | Tragic 11.8% |
| Belizeans | 0.0 /100 | #289 | Tragic 11.8% |
| Immigrants | Caribbean | 0.0 /100 | #290 | Tragic 11.8% |
| Central American Indians | 0.0 /100 | #291 | Tragic 11.9% |
| Immigrants | Senegal | 0.0 /100 | #292 | Tragic 11.9% |