Dominican vs Native/Alaskan Unemployment
COMPARE
Dominican
Native/Alaskan
Unemployment
Unemployment Comparison
Dominicans
Natives/Alaskans
7.4%
UNEMPLOYMENT
0.0/ 100
METRIC RATING
331st/ 347
METRIC RANK
7.0%
UNEMPLOYMENT
0.0/ 100
METRIC RATING
325th/ 347
METRIC RANK
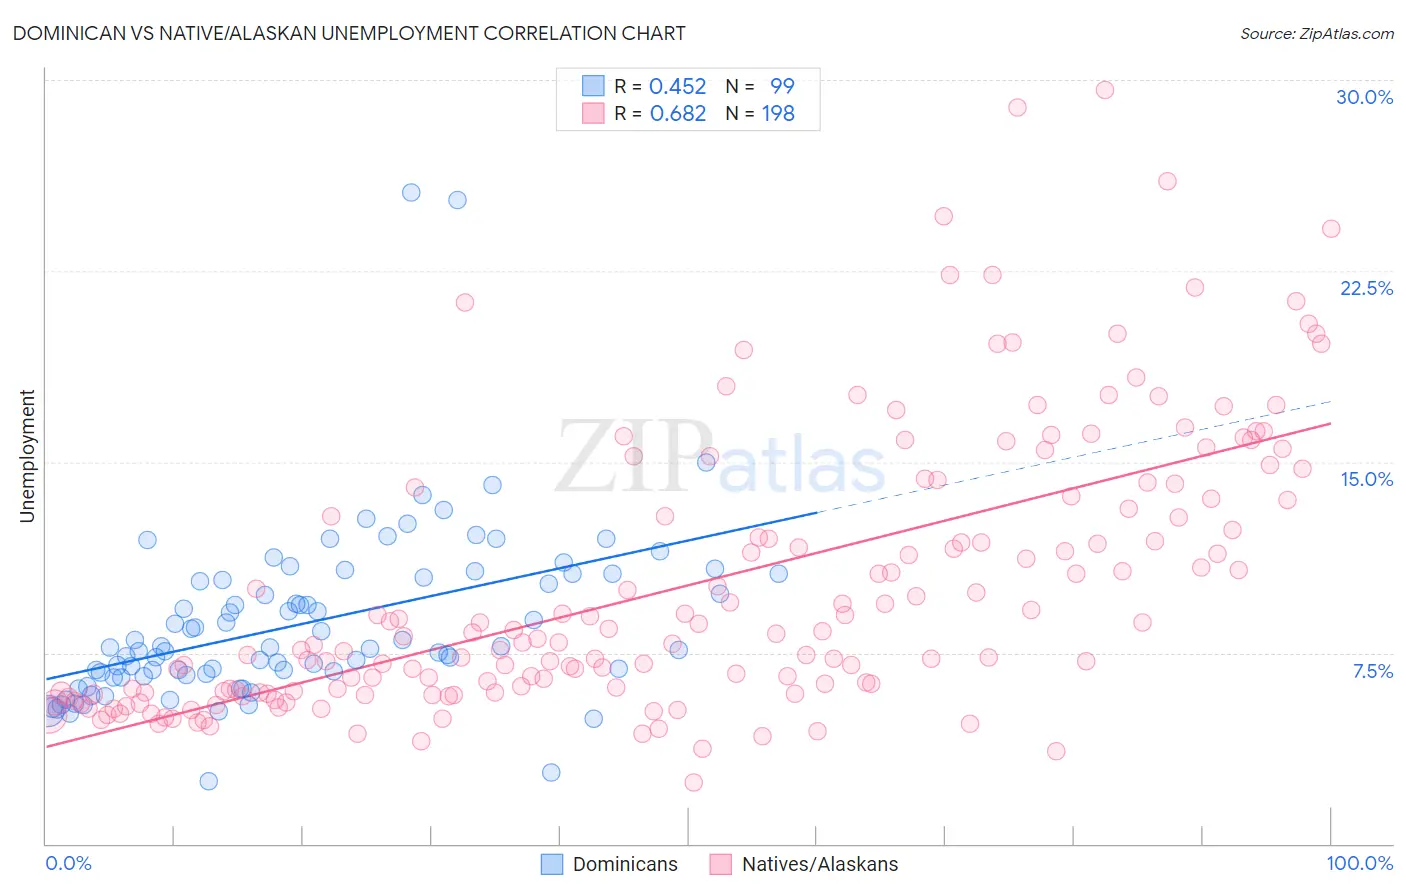
Dominican vs Native/Alaskan Unemployment Correlation Chart
The statistical analysis conducted on geographies consisting of 354,741,881 people shows a moderate positive correlation between the proportion of Dominicans and unemployment in the United States with a correlation coefficient (R) of 0.452 and weighted average of 7.4%. Similarly, the statistical analysis conducted on geographies consisting of 511,272,865 people shows a significant positive correlation between the proportion of Natives/Alaskans and unemployment in the United States with a correlation coefficient (R) of 0.682 and weighted average of 7.0%, a difference of 4.6%.
Unemployment Correlation Summary
| Measurement | Dominican | Native/Alaskan |
| Minimum | 2.5% | 2.4% |
| Maximum | 25.6% | 29.6% |
| Range | 23.1% | 27.2% |
| Mean | 8.6% | 10.2% |
| Median | 7.7% | 8.2% |
| Interquartile 25% (IQ1) | 6.6% | 6.0% |
| Interquartile 75% (IQ3) | 10.4% | 13.5% |
| Interquartile Range (IQR) | 3.8% | 7.6% |
| Standard Deviation (Sample) | 3.5% | 5.4% |
| Standard Deviation (Population) | 3.5% | 5.4% |
Demographics Similar to Dominicans and Natives/Alaskans by Unemployment
In terms of unemployment, the demographic groups most similar to Dominicans are Yakama (7.3%, a difference of 0.33%), Sioux (7.4%, a difference of 0.42%), Immigrants from Dominican Republic (7.4%, a difference of 0.48%), Apache (7.4%, a difference of 0.95%), and Alaska Native (7.2%, a difference of 1.6%). Similarly, the demographic groups most similar to Natives/Alaskans are Immigrants from Armenia (7.0%, a difference of 0.56%), Paiute (7.1%, a difference of 1.1%), Pueblo (7.2%, a difference of 1.7%), Immigrants from Grenada (6.9%, a difference of 1.7%), and Guyanese (6.9%, a difference of 2.1%).
| Demographics | Rating | Rank | Unemployment |
| Immigrants | Cabo Verde | 0.0 /100 | #318 | Tragic 6.8% |
| British West Indians | 0.0 /100 | #319 | Tragic 6.8% |
| Immigrants | St. Vincent and the Grenadines | 0.0 /100 | #320 | Tragic 6.9% |
| Immigrants | Guyana | 0.0 /100 | #321 | Tragic 6.9% |
| Guyanese | 0.0 /100 | #322 | Tragic 6.9% |
| Immigrants | Grenada | 0.0 /100 | #323 | Tragic 6.9% |
| Immigrants | Armenia | 0.0 /100 | #324 | Tragic 7.0% |
| Natives/Alaskans | 0.0 /100 | #325 | Tragic 7.0% |
| Paiute | 0.0 /100 | #326 | Tragic 7.1% |
| Pueblo | 0.0 /100 | #327 | Tragic 7.2% |
| Tsimshian | 0.0 /100 | #328 | Tragic 7.2% |
| Alaska Natives | 0.0 /100 | #329 | Tragic 7.2% |
| Yakama | 0.0 /100 | #330 | Tragic 7.3% |
| Dominicans | 0.0 /100 | #331 | Tragic 7.4% |
| Sioux | 0.0 /100 | #332 | Tragic 7.4% |
| Immigrants | Dominican Republic | 0.0 /100 | #333 | Tragic 7.4% |
| Apache | 0.0 /100 | #334 | Tragic 7.4% |
| Alaskan Athabascans | 0.0 /100 | #335 | Tragic 7.7% |
| Immigrants | Yemen | 0.0 /100 | #336 | Tragic 7.7% |
| Cheyenne | 0.0 /100 | #337 | Tragic 8.0% |
| Pima | 0.0 /100 | #338 | Tragic 8.2% |