Dominican vs Cajun Unemployment Among Women with Children Under 6 years
COMPARE
Dominican
Cajun
Unemployment Among Women with Children Under 6 years
Unemployment Among Women with Children Under 6 years Comparison
Dominicans
Cajuns
9.1%
UNEMPLOYMENT AMONG WOMEN WITH CHILDREN UNDER 6 YEARS
0.0/ 100
METRIC RATING
307th/ 347
METRIC RANK
9.2%
UNEMPLOYMENT AMONG WOMEN WITH CHILDREN UNDER 6 YEARS
0.0/ 100
METRIC RATING
310th/ 347
METRIC RANK
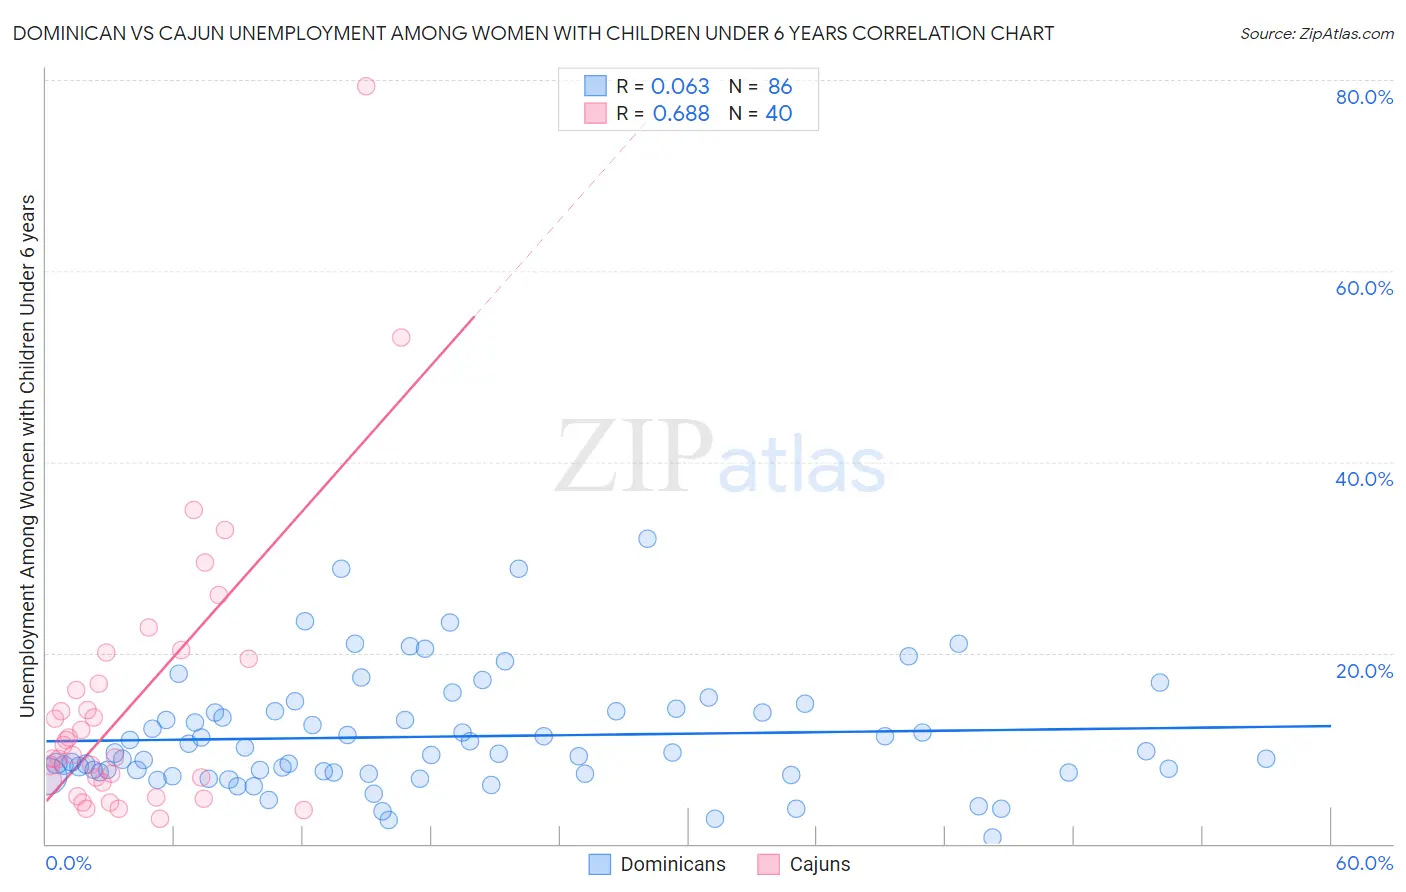
Dominican vs Cajun Unemployment Among Women with Children Under 6 years Correlation Chart
The statistical analysis conducted on geographies consisting of 277,955,592 people shows a slight positive correlation between the proportion of Dominicans and unemployment rate among women with children under the age of 6 in the United States with a correlation coefficient (R) of 0.063 and weighted average of 9.1%. Similarly, the statistical analysis conducted on geographies consisting of 126,859,508 people shows a significant positive correlation between the proportion of Cajuns and unemployment rate among women with children under the age of 6 in the United States with a correlation coefficient (R) of 0.688 and weighted average of 9.2%, a difference of 0.59%.
Unemployment Among Women with Children Under 6 years Correlation Summary
| Measurement | Dominican | Cajun |
| Minimum | 0.60% | 2.6% |
| Maximum | 31.9% | 79.4% |
| Range | 31.3% | 76.8% |
| Mean | 11.2% | 14.8% |
| Median | 9.5% | 9.8% |
| Interquartile 25% (IQ1) | 7.4% | 6.5% |
| Interquartile 75% (IQ3) | 13.8% | 18.1% |
| Interquartile Range (IQR) | 6.4% | 11.5% |
| Standard Deviation (Sample) | 6.1% | 14.7% |
| Standard Deviation (Population) | 6.0% | 14.6% |
Demographics Similar to Dominicans and Cajuns by Unemployment Among Women with Children Under 6 years
In terms of unemployment among women with children under 6 years, the demographic groups most similar to Dominicans are Immigrants from Micronesia (9.1%, a difference of 0.070%), Pueblo (9.1%, a difference of 0.12%), Alaskan Athabascan (9.1%, a difference of 0.29%), African (9.2%, a difference of 0.46%), and Immigrants from Mexico (9.1%, a difference of 0.70%). Similarly, the demographic groups most similar to Cajuns are African (9.2%, a difference of 0.13%), French American Indian (9.2%, a difference of 0.28%), Immigrants from the Azores (9.2%, a difference of 0.42%), Immigrants from Micronesia (9.1%, a difference of 0.53%), and Pueblo (9.1%, a difference of 0.71%).
| Demographics | Rating | Rank | Unemployment Among Women with Children Under 6 years |
| Tlingit-Haida | 0.0 /100 | #298 | Tragic 8.9% |
| Immigrants | Jamaica | 0.0 /100 | #299 | Tragic 8.9% |
| Creek | 0.0 /100 | #300 | Tragic 8.9% |
| Chickasaw | 0.0 /100 | #301 | Tragic 9.0% |
| Hispanics or Latinos | 0.0 /100 | #302 | Tragic 9.0% |
| Immigrants | West Indies | 0.0 /100 | #303 | Tragic 9.0% |
| Immigrants | Mexico | 0.0 /100 | #304 | Tragic 9.1% |
| Alaskan Athabascans | 0.0 /100 | #305 | Tragic 9.1% |
| Pueblo | 0.0 /100 | #306 | Tragic 9.1% |
| Dominicans | 0.0 /100 | #307 | Tragic 9.1% |
| Immigrants | Micronesia | 0.0 /100 | #308 | Tragic 9.1% |
| Africans | 0.0 /100 | #309 | Tragic 9.2% |
| Cajuns | 0.0 /100 | #310 | Tragic 9.2% |
| French American Indians | 0.0 /100 | #311 | Tragic 9.2% |
| Immigrants | Azores | 0.0 /100 | #312 | Tragic 9.2% |
| Americans | 0.0 /100 | #313 | Tragic 9.3% |
| Fijians | 0.0 /100 | #314 | Tragic 9.3% |
| Cherokee | 0.0 /100 | #315 | Tragic 9.3% |
| Houma | 0.0 /100 | #316 | Tragic 9.4% |
| Dutch West Indians | 0.0 /100 | #317 | Tragic 9.5% |
| Osage | 0.0 /100 | #318 | Tragic 9.5% |