Nigerian vs Romanian Unemployment Among Women with Children Under 6 years
COMPARE
Nigerian
Romanian
Unemployment Among Women with Children Under 6 years
Unemployment Among Women with Children Under 6 years Comparison
Nigerians
Romanians
8.2%
UNEMPLOYMENT AMONG WOMEN WITH CHILDREN UNDER 6 YEARS
1.1/ 100
METRIC RATING
250th/ 347
METRIC RANK
7.2%
UNEMPLOYMENT AMONG WOMEN WITH CHILDREN UNDER 6 YEARS
97.7/ 100
METRIC RATING
95th/ 347
METRIC RANK
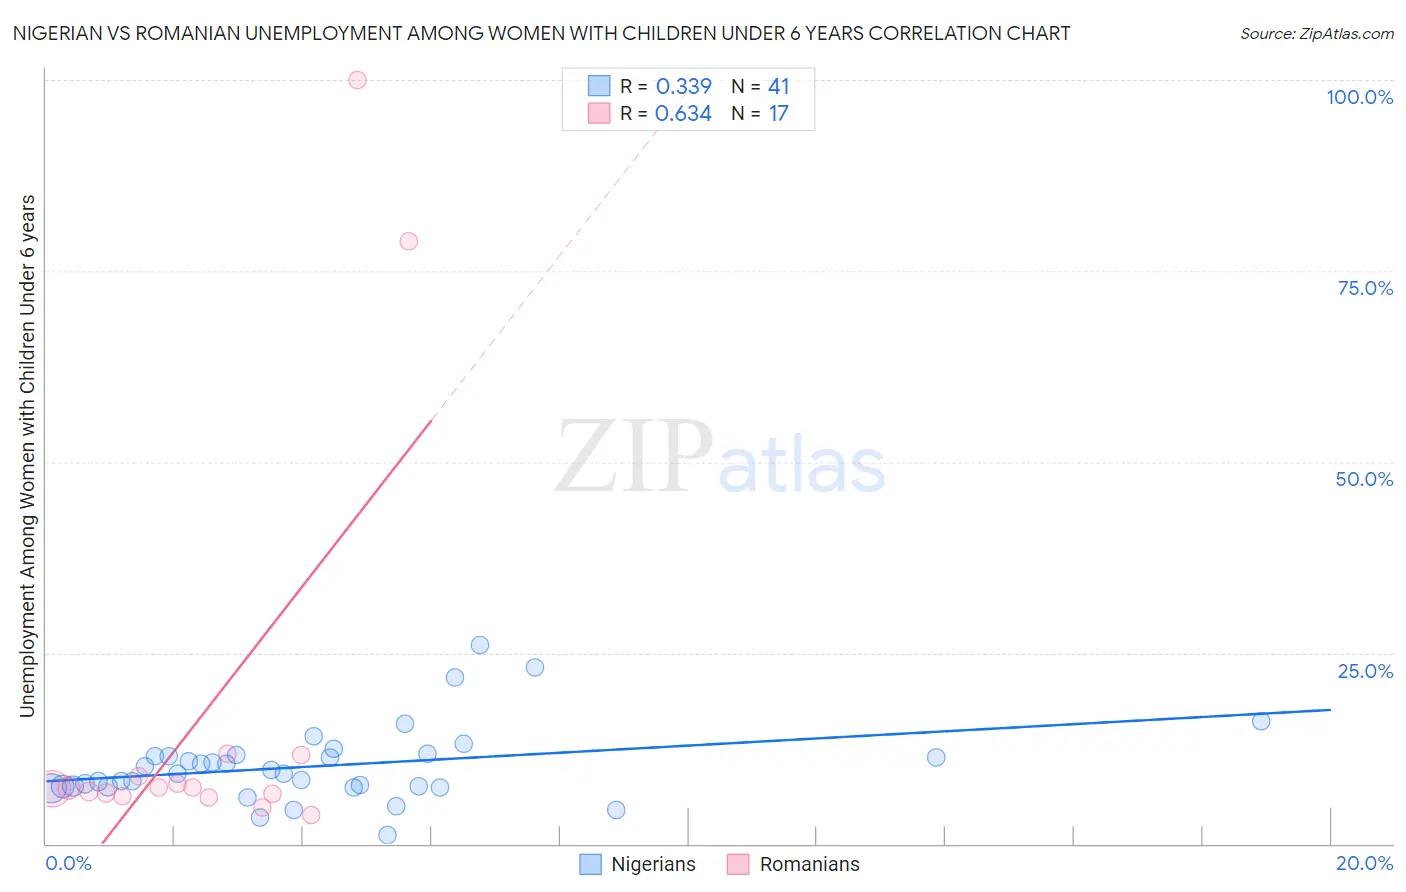
Nigerian vs Romanian Unemployment Among Women with Children Under 6 years Correlation Chart
The statistical analysis conducted on geographies consisting of 269,613,333 people shows a mild positive correlation between the proportion of Nigerians and unemployment rate among women with children under the age of 6 in the United States with a correlation coefficient (R) of 0.339 and weighted average of 8.2%. Similarly, the statistical analysis conducted on geographies consisting of 284,479,453 people shows a significant positive correlation between the proportion of Romanians and unemployment rate among women with children under the age of 6 in the United States with a correlation coefficient (R) of 0.634 and weighted average of 7.2%, a difference of 14.6%.
Unemployment Among Women with Children Under 6 years Correlation Summary
| Measurement | Nigerian | Romanian |
| Minimum | 1.1% | 3.8% |
| Maximum | 26.0% | 100.0% |
| Range | 24.9% | 96.2% |
| Mean | 10.2% | 17.0% |
| Median | 9.2% | 7.3% |
| Interquartile 25% (IQ1) | 7.5% | 6.4% |
| Interquartile 75% (IQ3) | 11.6% | 10.3% |
| Interquartile Range (IQR) | 4.1% | 3.9% |
| Standard Deviation (Sample) | 4.9% | 27.6% |
| Standard Deviation (Population) | 4.9% | 26.8% |
Similar Demographics by Unemployment Among Women with Children Under 6 years
Demographics Similar to Nigerians by Unemployment Among Women with Children Under 6 years
In terms of unemployment among women with children under 6 years, the demographic groups most similar to Nigerians are Immigrants from Sierra Leone (8.2%, a difference of 0.010%), Immigrants from Western Africa (8.2%, a difference of 0.10%), German Russian (8.2%, a difference of 0.14%), Guyanese (8.2%, a difference of 0.17%), and Ghanaian (8.2%, a difference of 0.17%).
| Demographics | Rating | Rank | Unemployment Among Women with Children Under 6 years |
| Hawaiians | 1.8 /100 | #243 | Tragic 8.2% |
| French | 1.7 /100 | #244 | Tragic 8.2% |
| Native Hawaiians | 1.7 /100 | #245 | Tragic 8.2% |
| Central Americans | 1.4 /100 | #246 | Tragic 8.2% |
| German Russians | 1.2 /100 | #247 | Tragic 8.2% |
| Immigrants | Western Africa | 1.1 /100 | #248 | Tragic 8.2% |
| Immigrants | Sierra Leone | 1.1 /100 | #249 | Tragic 8.2% |
| Nigerians | 1.1 /100 | #250 | Tragic 8.2% |
| Guyanese | 1.0 /100 | #251 | Tragic 8.2% |
| Ghanaians | 1.0 /100 | #252 | Tragic 8.2% |
| Immigrants | Guyana | 0.8 /100 | #253 | Tragic 8.2% |
| Immigrants | Caribbean | 0.7 /100 | #254 | Tragic 8.3% |
| Immigrants | Portugal | 0.6 /100 | #255 | Tragic 8.3% |
| Celtics | 0.6 /100 | #256 | Tragic 8.3% |
| British West Indians | 0.5 /100 | #257 | Tragic 8.3% |
Demographics Similar to Romanians by Unemployment Among Women with Children Under 6 years
In terms of unemployment among women with children under 6 years, the demographic groups most similar to Romanians are Immigrants from Eastern Africa (7.2%, a difference of 0.010%), Macedonian (7.2%, a difference of 0.040%), Immigrants from South Eastern Asia (7.2%, a difference of 0.090%), New Zealander (7.2%, a difference of 0.11%), and Russian (7.2%, a difference of 0.12%).
| Demographics | Rating | Rank | Unemployment Among Women with Children Under 6 years |
| Immigrants | Hungary | 98.3 /100 | #88 | Exceptional 7.1% |
| Immigrants | Denmark | 98.3 /100 | #89 | Exceptional 7.1% |
| Immigrants | Spain | 98.2 /100 | #90 | Exceptional 7.1% |
| Danes | 98.2 /100 | #91 | Exceptional 7.1% |
| Albanians | 98.0 /100 | #92 | Exceptional 7.2% |
| New Zealanders | 97.8 /100 | #93 | Exceptional 7.2% |
| Macedonians | 97.7 /100 | #94 | Exceptional 7.2% |
| Romanians | 97.7 /100 | #95 | Exceptional 7.2% |
| Immigrants | Eastern Africa | 97.7 /100 | #96 | Exceptional 7.2% |
| Immigrants | South Eastern Asia | 97.6 /100 | #97 | Exceptional 7.2% |
| Russians | 97.5 /100 | #98 | Exceptional 7.2% |
| Immigrants | Europe | 97.5 /100 | #99 | Exceptional 7.2% |
| Immigrants | Northern Europe | 97.4 /100 | #100 | Exceptional 7.2% |
| Chileans | 97.4 /100 | #101 | Exceptional 7.2% |
| Immigrants | Nicaragua | 97.3 /100 | #102 | Exceptional 7.2% |