Dominican vs Immigrants from Northern Africa Unemployment Among Women with Children Under 6 years
COMPARE
Dominican
Immigrants from Northern Africa
Unemployment Among Women with Children Under 6 years
Unemployment Among Women with Children Under 6 years Comparison
Dominicans
Immigrants from Northern Africa
9.1%
UNEMPLOYMENT AMONG WOMEN WITH CHILDREN UNDER 6 YEARS
0.0/ 100
METRIC RATING
307th/ 347
METRIC RANK
7.4%
UNEMPLOYMENT AMONG WOMEN WITH CHILDREN UNDER 6 YEARS
85.3/ 100
METRIC RATING
135th/ 347
METRIC RANK
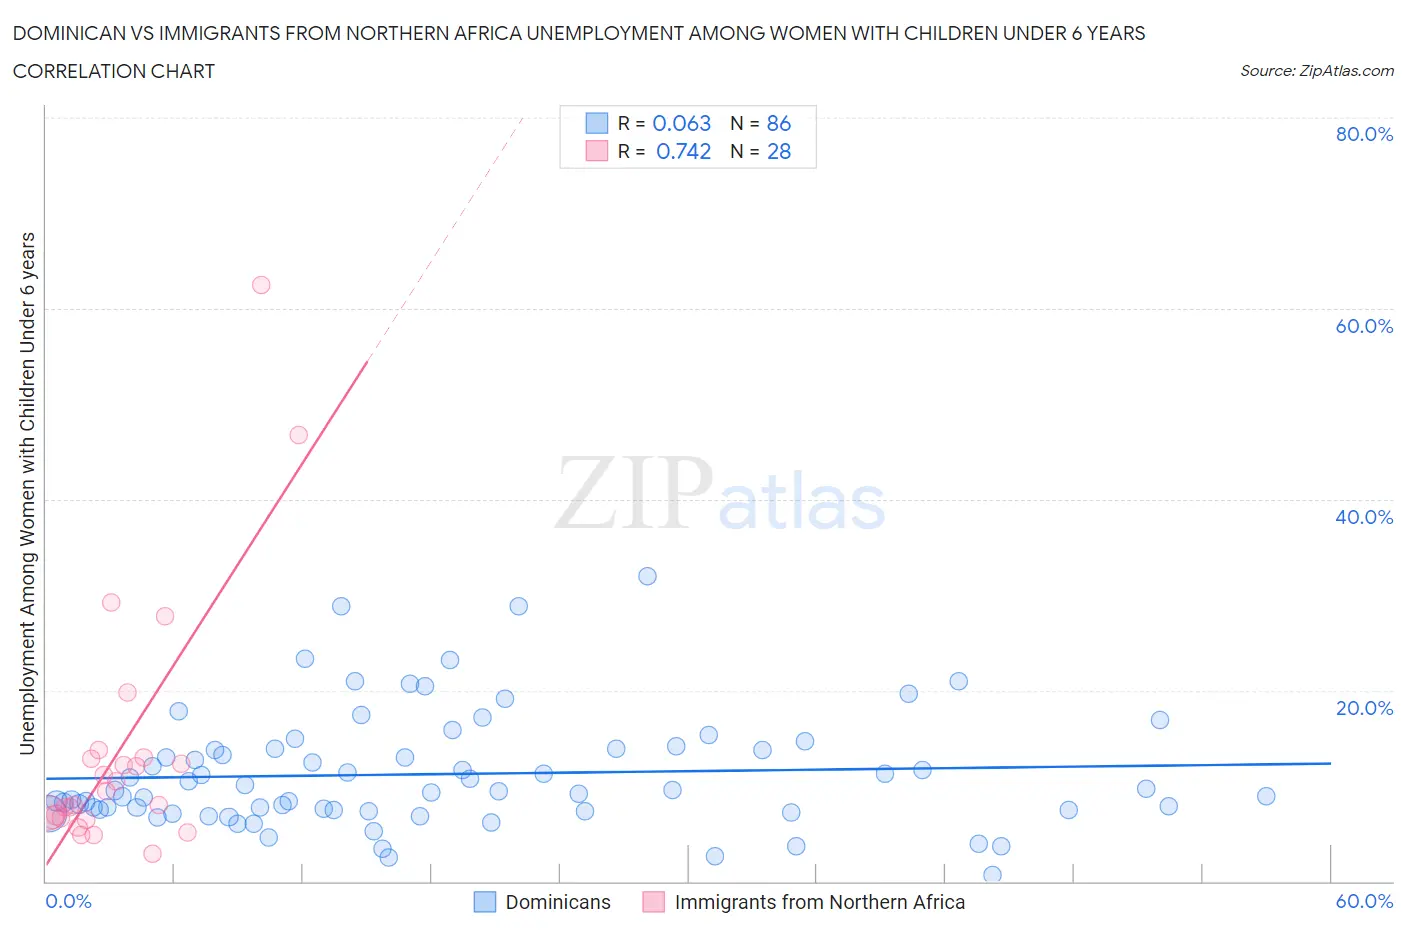
Dominican vs Immigrants from Northern Africa Unemployment Among Women with Children Under 6 years Correlation Chart
The statistical analysis conducted on geographies consisting of 277,955,592 people shows a slight positive correlation between the proportion of Dominicans and unemployment rate among women with children under the age of 6 in the United States with a correlation coefficient (R) of 0.063 and weighted average of 9.1%. Similarly, the statistical analysis conducted on geographies consisting of 256,290,723 people shows a strong positive correlation between the proportion of Immigrants from Northern Africa and unemployment rate among women with children under the age of 6 in the United States with a correlation coefficient (R) of 0.742 and weighted average of 7.4%, a difference of 22.9%.
Unemployment Among Women with Children Under 6 years Correlation Summary
| Measurement | Dominican | Immigrants from Northern Africa |
| Minimum | 0.60% | 2.9% |
| Maximum | 31.9% | 62.5% |
| Range | 31.3% | 59.6% |
| Mean | 11.2% | 13.6% |
| Median | 9.5% | 8.7% |
| Interquartile 25% (IQ1) | 7.4% | 6.6% |
| Interquartile 75% (IQ3) | 13.8% | 12.9% |
| Interquartile Range (IQR) | 6.4% | 6.3% |
| Standard Deviation (Sample) | 6.1% | 13.3% |
| Standard Deviation (Population) | 6.0% | 13.1% |
Similar Demographics by Unemployment Among Women with Children Under 6 years
Demographics Similar to Dominicans by Unemployment Among Women with Children Under 6 years
In terms of unemployment among women with children under 6 years, the demographic groups most similar to Dominicans are Immigrants from Micronesia (9.1%, a difference of 0.070%), Pueblo (9.1%, a difference of 0.12%), Alaskan Athabascan (9.1%, a difference of 0.29%), African (9.2%, a difference of 0.46%), and Cajun (9.2%, a difference of 0.59%).
| Demographics | Rating | Rank | Unemployment Among Women with Children Under 6 years |
| Creek | 0.0 /100 | #300 | Tragic 8.9% |
| Chickasaw | 0.0 /100 | #301 | Tragic 9.0% |
| Hispanics or Latinos | 0.0 /100 | #302 | Tragic 9.0% |
| Immigrants | West Indies | 0.0 /100 | #303 | Tragic 9.0% |
| Immigrants | Mexico | 0.0 /100 | #304 | Tragic 9.1% |
| Alaskan Athabascans | 0.0 /100 | #305 | Tragic 9.1% |
| Pueblo | 0.0 /100 | #306 | Tragic 9.1% |
| Dominicans | 0.0 /100 | #307 | Tragic 9.1% |
| Immigrants | Micronesia | 0.0 /100 | #308 | Tragic 9.1% |
| Africans | 0.0 /100 | #309 | Tragic 9.2% |
| Cajuns | 0.0 /100 | #310 | Tragic 9.2% |
| French American Indians | 0.0 /100 | #311 | Tragic 9.2% |
| Immigrants | Azores | 0.0 /100 | #312 | Tragic 9.2% |
| Americans | 0.0 /100 | #313 | Tragic 9.3% |
| Fijians | 0.0 /100 | #314 | Tragic 9.3% |
Demographics Similar to Immigrants from Northern Africa by Unemployment Among Women with Children Under 6 years
In terms of unemployment among women with children under 6 years, the demographic groups most similar to Immigrants from Northern Africa are Immigrants from Bolivia (7.4%, a difference of 0.060%), Immigrants from Morocco (7.4%, a difference of 0.060%), Immigrants from Cambodia (7.4%, a difference of 0.090%), Immigrants from Uganda (7.4%, a difference of 0.17%), and Immigrants from Norway (7.4%, a difference of 0.17%).
| Demographics | Rating | Rank | Unemployment Among Women with Children Under 6 years |
| Zimbabweans | 91.5 /100 | #128 | Exceptional 7.3% |
| Slovenes | 89.2 /100 | #129 | Excellent 7.4% |
| Swedes | 88.4 /100 | #130 | Excellent 7.4% |
| Ukrainians | 88.2 /100 | #131 | Excellent 7.4% |
| Immigrants | Armenia | 87.4 /100 | #132 | Excellent 7.4% |
| Immigrants | Uganda | 86.5 /100 | #133 | Excellent 7.4% |
| Immigrants | Bolivia | 85.7 /100 | #134 | Excellent 7.4% |
| Immigrants | Northern Africa | 85.3 /100 | #135 | Excellent 7.4% |
| Immigrants | Morocco | 84.9 /100 | #136 | Excellent 7.4% |
| Immigrants | Cambodia | 84.6 /100 | #137 | Excellent 7.4% |
| Immigrants | Norway | 84.1 /100 | #138 | Excellent 7.4% |
| Immigrants | Colombia | 83.9 /100 | #139 | Excellent 7.4% |
| Scandinavians | 83.0 /100 | #140 | Excellent 7.4% |
| Greeks | 82.6 /100 | #141 | Excellent 7.4% |
| Immigrants | Argentina | 81.5 /100 | #142 | Excellent 7.5% |