Shoshone vs Romanian Unemployment Among Women with Children Under 6 years
COMPARE
Shoshone
Romanian
Unemployment Among Women with Children Under 6 years
Unemployment Among Women with Children Under 6 years Comparison
Shoshone
Romanians
13.2%
UNEMPLOYMENT AMONG WOMEN WITH CHILDREN UNDER 6 YEARS
0.0/ 100
METRIC RATING
336th/ 347
METRIC RANK
7.2%
UNEMPLOYMENT AMONG WOMEN WITH CHILDREN UNDER 6 YEARS
97.7/ 100
METRIC RATING
95th/ 347
METRIC RANK
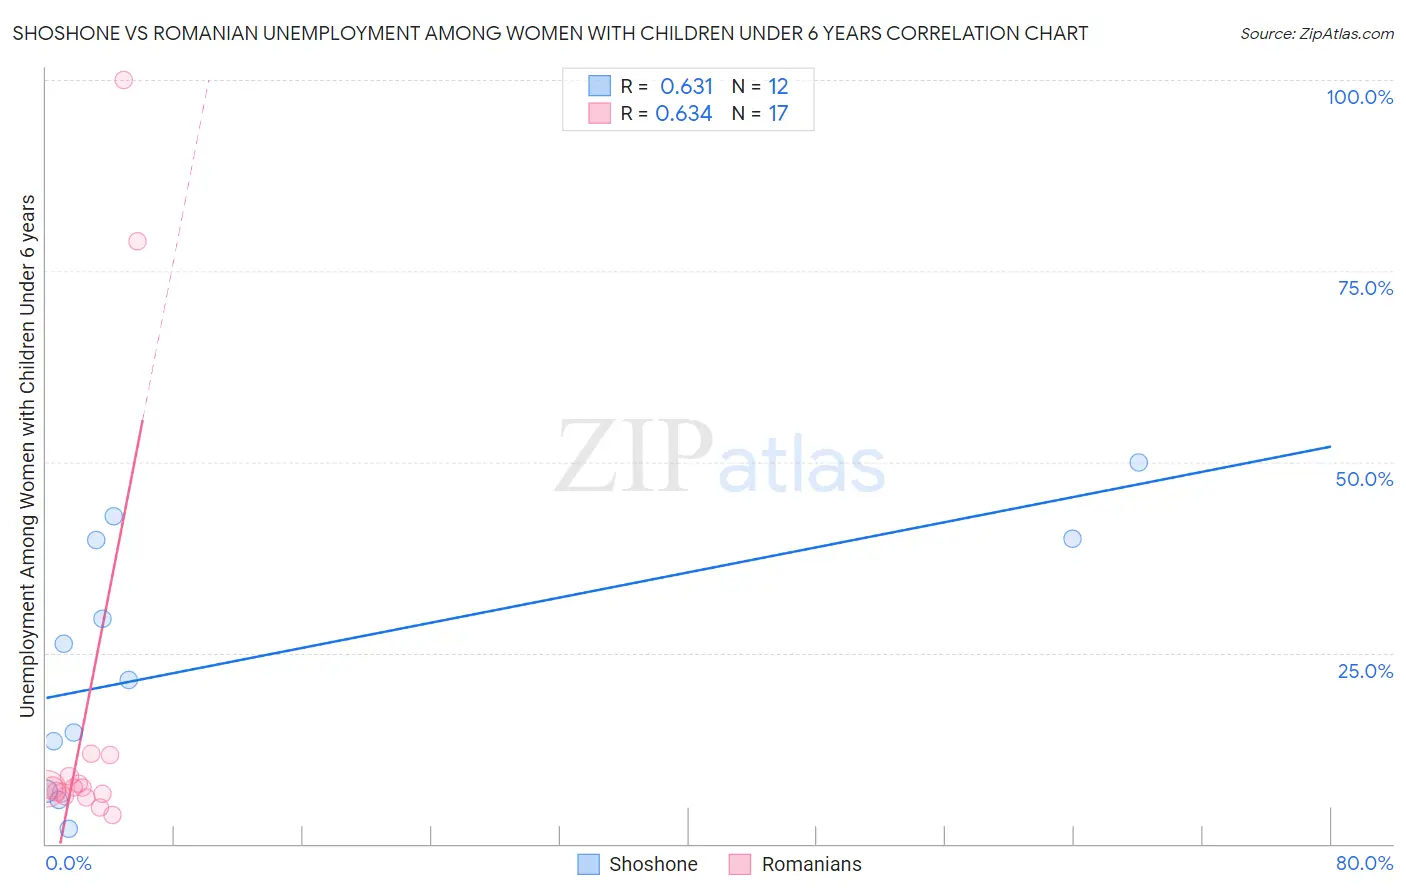
Shoshone vs Romanian Unemployment Among Women with Children Under 6 years Correlation Chart
The statistical analysis conducted on geographies consisting of 60,930,865 people shows a significant positive correlation between the proportion of Shoshone and unemployment rate among women with children under the age of 6 in the United States with a correlation coefficient (R) of 0.631 and weighted average of 13.2%. Similarly, the statistical analysis conducted on geographies consisting of 284,479,453 people shows a significant positive correlation between the proportion of Romanians and unemployment rate among women with children under the age of 6 in the United States with a correlation coefficient (R) of 0.634 and weighted average of 7.2%, a difference of 83.8%.
Unemployment Among Women with Children Under 6 years Correlation Summary
| Measurement | Shoshone | Romanian |
| Minimum | 1.9% | 3.8% |
| Maximum | 50.0% | 100.0% |
| Range | 48.1% | 96.2% |
| Mean | 24.3% | 17.0% |
| Median | 23.8% | 7.3% |
| Interquartile 25% (IQ1) | 10.1% | 6.4% |
| Interquartile 75% (IQ3) | 39.9% | 10.3% |
| Interquartile Range (IQR) | 29.8% | 3.9% |
| Standard Deviation (Sample) | 16.2% | 27.6% |
| Standard Deviation (Population) | 15.5% | 26.8% |
Similar Demographics by Unemployment Among Women with Children Under 6 years
Demographics Similar to Shoshone by Unemployment Among Women with Children Under 6 years
In terms of unemployment among women with children under 6 years, the demographic groups most similar to Shoshone are Chippewa (13.3%, a difference of 1.1%), Pima (13.4%, a difference of 1.9%), Navajo (13.5%, a difference of 2.3%), Immigrants from Yemen (13.5%, a difference of 2.3%), and Lumbee (13.8%, a difference of 4.6%).
| Demographics | Rating | Rank | Unemployment Among Women with Children Under 6 years |
| Blacks/African Americans | 0.0 /100 | #329 | Tragic 10.3% |
| Pennsylvania Germans | 0.0 /100 | #330 | Tragic 10.8% |
| Colville | 0.0 /100 | #331 | Tragic 11.2% |
| Sioux | 0.0 /100 | #332 | Tragic 11.5% |
| Natives/Alaskans | 0.0 /100 | #333 | Tragic 11.5% |
| Apache | 0.0 /100 | #334 | Tragic 12.3% |
| Puerto Ricans | 0.0 /100 | #335 | Tragic 12.5% |
| Shoshone | 0.0 /100 | #336 | Tragic 13.2% |
| Chippewa | 0.0 /100 | #337 | Tragic 13.3% |
| Pima | 0.0 /100 | #338 | Tragic 13.4% |
| Navajo | 0.0 /100 | #339 | Tragic 13.5% |
| Immigrants | Yemen | 0.0 /100 | #340 | Tragic 13.5% |
| Lumbee | 0.0 /100 | #341 | Tragic 13.8% |
| Yuman | 0.0 /100 | #342 | Tragic 14.6% |
| Crow | 0.0 /100 | #343 | Tragic 14.6% |
Demographics Similar to Romanians by Unemployment Among Women with Children Under 6 years
In terms of unemployment among women with children under 6 years, the demographic groups most similar to Romanians are Immigrants from Eastern Africa (7.2%, a difference of 0.010%), Macedonian (7.2%, a difference of 0.040%), Immigrants from South Eastern Asia (7.2%, a difference of 0.090%), New Zealander (7.2%, a difference of 0.11%), and Russian (7.2%, a difference of 0.12%).
| Demographics | Rating | Rank | Unemployment Among Women with Children Under 6 years |
| Immigrants | Hungary | 98.3 /100 | #88 | Exceptional 7.1% |
| Immigrants | Denmark | 98.3 /100 | #89 | Exceptional 7.1% |
| Immigrants | Spain | 98.2 /100 | #90 | Exceptional 7.1% |
| Danes | 98.2 /100 | #91 | Exceptional 7.1% |
| Albanians | 98.0 /100 | #92 | Exceptional 7.2% |
| New Zealanders | 97.8 /100 | #93 | Exceptional 7.2% |
| Macedonians | 97.7 /100 | #94 | Exceptional 7.2% |
| Romanians | 97.7 /100 | #95 | Exceptional 7.2% |
| Immigrants | Eastern Africa | 97.7 /100 | #96 | Exceptional 7.2% |
| Immigrants | South Eastern Asia | 97.6 /100 | #97 | Exceptional 7.2% |
| Russians | 97.5 /100 | #98 | Exceptional 7.2% |
| Immigrants | Europe | 97.5 /100 | #99 | Exceptional 7.2% |
| Immigrants | Northern Europe | 97.4 /100 | #100 | Exceptional 7.2% |
| Chileans | 97.4 /100 | #101 | Exceptional 7.2% |
| Immigrants | Nicaragua | 97.3 /100 | #102 | Exceptional 7.2% |