Immigrants from Czechoslovakia vs Romanian Unemployment Among Women with Children Under 6 years
COMPARE
Immigrants from Czechoslovakia
Romanian
Unemployment Among Women with Children Under 6 years
Unemployment Among Women with Children Under 6 years Comparison
Immigrants from Czechoslovakia
Romanians
7.0%
UNEMPLOYMENT AMONG WOMEN WITH CHILDREN UNDER 6 YEARS
99.2/ 100
METRIC RATING
73rd/ 347
METRIC RANK
7.2%
UNEMPLOYMENT AMONG WOMEN WITH CHILDREN UNDER 6 YEARS
97.7/ 100
METRIC RATING
95th/ 347
METRIC RANK
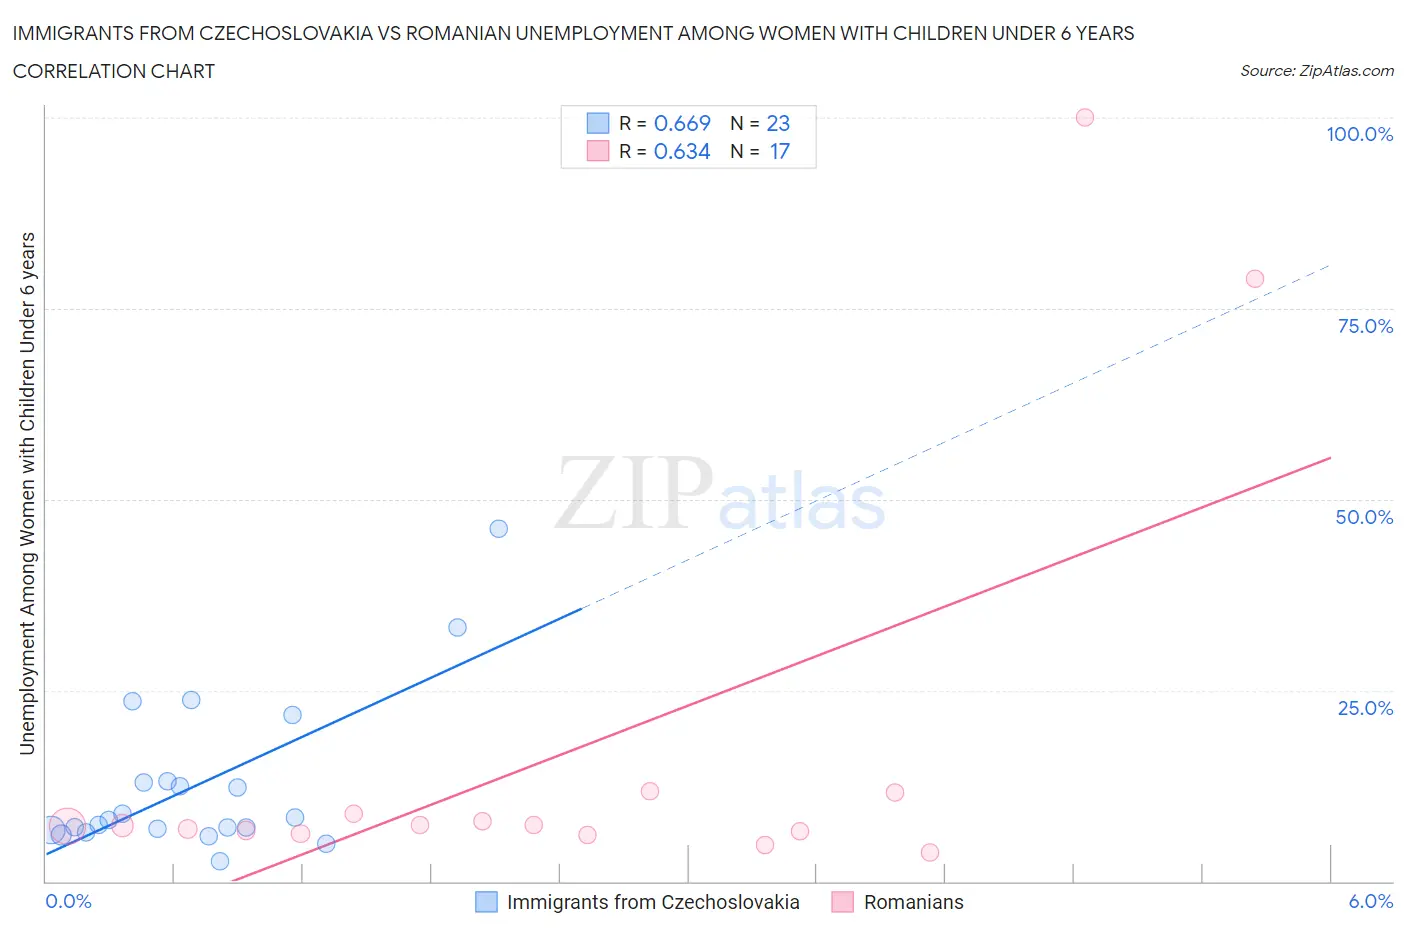
Immigrants from Czechoslovakia vs Romanian Unemployment Among Women with Children Under 6 years Correlation Chart
The statistical analysis conducted on geographies consisting of 163,653,873 people shows a significant positive correlation between the proportion of Immigrants from Czechoslovakia and unemployment rate among women with children under the age of 6 in the United States with a correlation coefficient (R) of 0.669 and weighted average of 7.0%. Similarly, the statistical analysis conducted on geographies consisting of 284,479,453 people shows a significant positive correlation between the proportion of Romanians and unemployment rate among women with children under the age of 6 in the United States with a correlation coefficient (R) of 0.634 and weighted average of 7.2%, a difference of 1.9%.
Unemployment Among Women with Children Under 6 years Correlation Summary
| Measurement | Immigrants from Czechoslovakia | Romanian |
| Minimum | 2.7% | 3.8% |
| Maximum | 46.2% | 100.0% |
| Range | 43.5% | 96.2% |
| Mean | 12.7% | 17.0% |
| Median | 8.0% | 7.3% |
| Interquartile 25% (IQ1) | 6.6% | 6.4% |
| Interquartile 75% (IQ3) | 13.2% | 10.3% |
| Interquartile Range (IQR) | 6.5% | 3.9% |
| Standard Deviation (Sample) | 10.5% | 27.6% |
| Standard Deviation (Population) | 10.2% | 26.8% |
Similar Demographics by Unemployment Among Women with Children Under 6 years
Demographics Similar to Immigrants from Czechoslovakia by Unemployment Among Women with Children Under 6 years
In terms of unemployment among women with children under 6 years, the demographic groups most similar to Immigrants from Czechoslovakia are Turkish (7.0%, a difference of 0.010%), Immigrants from Eastern Europe (7.1%, a difference of 0.40%), Estonian (7.1%, a difference of 0.45%), Immigrants from Croatia (7.1%, a difference of 0.49%), and Cuban (7.0%, a difference of 0.52%).
| Demographics | Rating | Rank | Unemployment Among Women with Children Under 6 years |
| Immigrants | Belgium | 99.6 /100 | #66 | Exceptional 6.9% |
| Immigrants | Netherlands | 99.5 /100 | #67 | Exceptional 7.0% |
| Paraguayans | 99.4 /100 | #68 | Exceptional 7.0% |
| Immigrants | Eritrea | 99.4 /100 | #69 | Exceptional 7.0% |
| Immigrants | Iraq | 99.4 /100 | #70 | Exceptional 7.0% |
| Afghans | 99.4 /100 | #71 | Exceptional 7.0% |
| Cubans | 99.4 /100 | #72 | Exceptional 7.0% |
| Immigrants | Czechoslovakia | 99.2 /100 | #73 | Exceptional 7.0% |
| Turks | 99.2 /100 | #74 | Exceptional 7.0% |
| Immigrants | Eastern Europe | 99.0 /100 | #75 | Exceptional 7.1% |
| Estonians | 99.0 /100 | #76 | Exceptional 7.1% |
| Immigrants | Croatia | 98.9 /100 | #77 | Exceptional 7.1% |
| Immigrants | Somalia | 98.9 /100 | #78 | Exceptional 7.1% |
| Immigrants | Fiji | 98.9 /100 | #79 | Exceptional 7.1% |
| Immigrants | Greece | 98.9 /100 | #80 | Exceptional 7.1% |
Demographics Similar to Romanians by Unemployment Among Women with Children Under 6 years
In terms of unemployment among women with children under 6 years, the demographic groups most similar to Romanians are Immigrants from Eastern Africa (7.2%, a difference of 0.010%), Macedonian (7.2%, a difference of 0.040%), Immigrants from South Eastern Asia (7.2%, a difference of 0.090%), New Zealander (7.2%, a difference of 0.11%), and Russian (7.2%, a difference of 0.12%).
| Demographics | Rating | Rank | Unemployment Among Women with Children Under 6 years |
| Immigrants | Hungary | 98.3 /100 | #88 | Exceptional 7.1% |
| Immigrants | Denmark | 98.3 /100 | #89 | Exceptional 7.1% |
| Immigrants | Spain | 98.2 /100 | #90 | Exceptional 7.1% |
| Danes | 98.2 /100 | #91 | Exceptional 7.1% |
| Albanians | 98.0 /100 | #92 | Exceptional 7.2% |
| New Zealanders | 97.8 /100 | #93 | Exceptional 7.2% |
| Macedonians | 97.7 /100 | #94 | Exceptional 7.2% |
| Romanians | 97.7 /100 | #95 | Exceptional 7.2% |
| Immigrants | Eastern Africa | 97.7 /100 | #96 | Exceptional 7.2% |
| Immigrants | South Eastern Asia | 97.6 /100 | #97 | Exceptional 7.2% |
| Russians | 97.5 /100 | #98 | Exceptional 7.2% |
| Immigrants | Europe | 97.5 /100 | #99 | Exceptional 7.2% |
| Immigrants | Northern Europe | 97.4 /100 | #100 | Exceptional 7.2% |
| Chileans | 97.4 /100 | #101 | Exceptional 7.2% |
| Immigrants | Nicaragua | 97.3 /100 | #102 | Exceptional 7.2% |